In Part 1 of this series, we introduced Amazon Quick Sight Multi-Dataset Relationships and covered the foundational concepts of dimensional modeling, best practices for designing clean data models, and a decision framework for when to use runtime joins versus pre-joined datasets. If you haven’t read Part 1 yet, we recommend starting there.
In this post, we shift from concepts to patterns. For each schema, you’ll find a table structure, use cases, implementation steps, and sample SQL queries. We also cover workarounds for advanced scenarios that require extra modeling steps, and close with a summary of current limitations.
Note: All Multi-Dataset relationships in the current release use inner join. Only rows with matching keys in both datasets appear in query results. Design your data model accordingly.
Supported patterns
The following seven scenarios are natively supported by Quick Sight Multi-Dataset Relationships. Each scenario maps to a common data modeling pattern, with concrete implementation guidance and sample SQL.
Scenario 1: Simple star schema
The most common and recommended pattern. A central fact dataset is related to multiple dimension datasets.
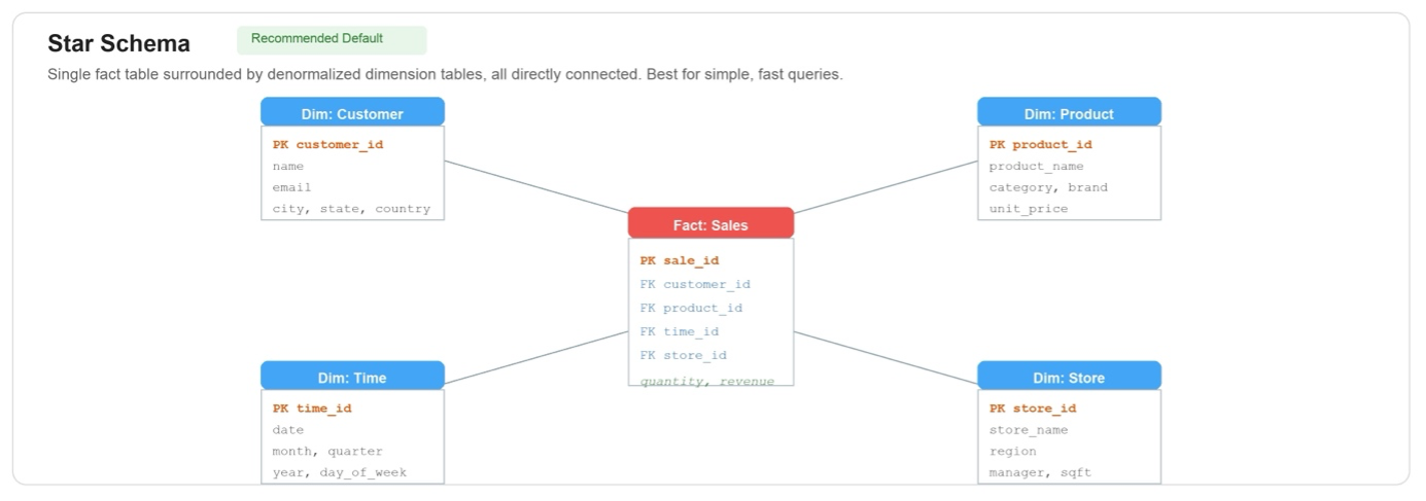
| Table | Type | Cardinality | Key Columns | Attributes/Measures |
| SALES_FACT | Fact | High: Millions to billions of rows | sale_id (PK) customer_id (FK) product_id (FK) time_id (FK) store_id (FK) | quantity revenue cost |
| CUSTOMER_DIM | Dimension | Medium: Thousands to millions of rows | customer_id (PK) | name, email, city, state, country, segment |
| PRODUCT_DIM | Dimension | Low: Hundreds to thousands of rows | product_id (PK) | product_name, category, brand, unit_price |
| TIME_DIM | Dimension | Low | time_id (PK) | date, month, quarter, year, day_of_week |
| STORE_DIM | Dimension | Low to Medium | store_id (PK) | store_name, region, manager, sqft |
Use cases
- Total sales by customer segment and region.
- Monthly revenue trend by product category.
- Top 10 stores by average order value.
Implementation
- Create separate datasets for each fact and dimension table.
- Define relationships via matching keys:
- All joins are single-hop (fact to dimension), with no chaining required.
- Denormalized dimensions support fast GROUP BY operations without extra joins.
Sample queries
Total sales by customer segment and region:
Scenario 2: Snowflake schema
A snowflake schema extends the star by normalizing dimension tables into chains. For example, a Customer dimension might link to a Geography table, which links to a Region table. Each table stays at its own grain.
Dimension tables are normalized into multi-level chains.
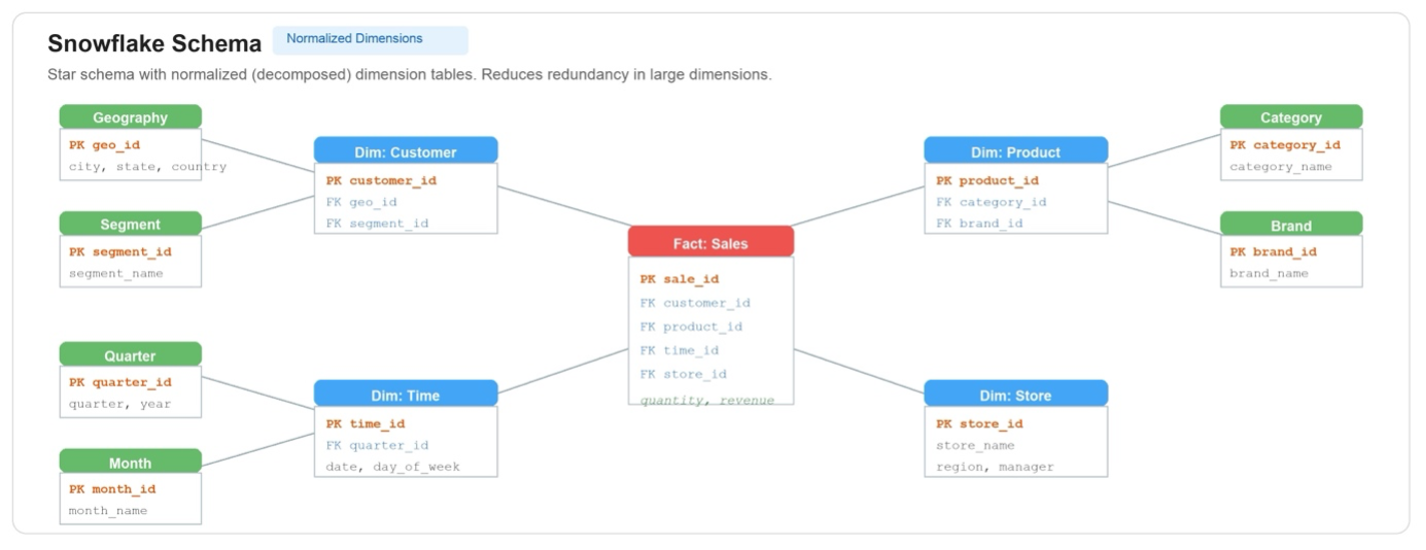
| Table | Type | Key Columns | Attributes/Measures |
| SALES_FACT | Fact | sale_id (PK) customer_id (FK) product_id (FK) time_id (FK) store_id (FK) | quantity revenue |
| CUSTOMER_DIM | Dimension | customer_id (PK) geo_id (FK) segment_id (FK) | name, email |
| GEOGRAPHY | Sub-Dimension | geo_id (PK) | city, state country |
| SEGMENT | Sub-Dimension | segment_id (PK) | segment_name |
| PRODUCT_DIM | Dimension | product_id (PK) category_id (FK) brand_id (FK) | product_name unit_price |
| CATEGORY | Sub-Dimension | category_id (PK) | category_name |
| BRAND | Sub-Dimension | brand_id (PK) | brand_name |
| TIME_DIM | Dimension | time_id (PK) quarter_id (FK) | date day_of_week |
| QUARTER | Sub-Dimension | quarter_id (PK) | quarter, year |
Use cases
- Sales breakdown by geographic hierarchy (country → state → city).
- Product performance by brand and category independently.
Key consideration
The multi-hop join (fact → customer → geography) increases query complexity slightly. Pre-join snowflake chains into a single flat dimension dataset unless the dimension is very large (>1M rows) and storage reduction justifies the added join hop.
Sample query
Sales by geographic hierarchy:
Scenario 3: Galaxy / constellation schema (multi-fact with shared/conformed dimensions)
Multiple fact tables share common (conformed) dimension tables. This supports cross-process analytics. For example, you can compare sales versus returns using shared product and customer dimensions.
Multiple fact tables share common conformed dimensions.
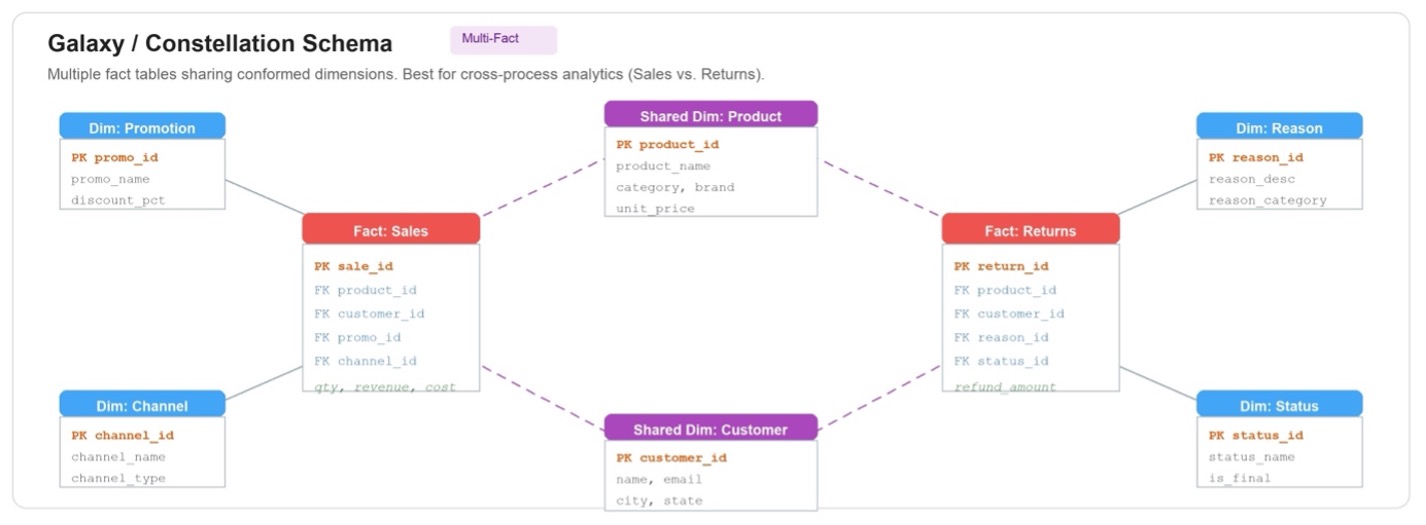
| Table | Type | Key Columns | Attributes/Measures |
| SALES_FACT | Fact | sale_id (PK) product_id (FK) customer_id (FK) promo_id (FK) channel_id (FK) | quantity, revenue, cost |
| RETURNS_FACT | Fact | return_id (PK) product_id (FK) customer_id (FK) reason_id (FK) status_id (FK) | refund_amount |
| PRODUCT_DIM | Shared Dim | product_id (PK) | product_name, category brand, unit_price |
| CUSTOMER_DIM | Shared Dim | customer_id (PK) | name, email city, state |
| PROMOTION_DIM | Sales-only | promo_id (PK) | promo_name, discount_pct |
| CHANNEL_DIM | Sales-only | channel_id (PK) | channel_name, channel_type |
| REASON_DIM | Returns-only | reason_id (PK) | reason_desc, reason_category |
| STATUS_DIM | Returns-only | status_id (PK) | status_name, is_final |
Use cases
- Return rate by product (Total Returns / Total Sales).
- Period-over-period comparison of returns versus sales.
- Cross-process analysis: which promotions drive the most returns?
Key consideration
Conformed dimensions must use identical grain and keys across both fact tables. Querying across facts uses shared dimensions as the “bridge” for the join.
Sample query
Which promotions drive the most returns?
Scenario 4: Role-playing dimensions
A single dimension table (for example, Date) is referenced multiple times by the same fact table, each time in a different analytical role. In Quick Sight, create three separate datasets all based on the same underlying DATE_DIM source table.
A single date dimension serves multiple analytical roles.
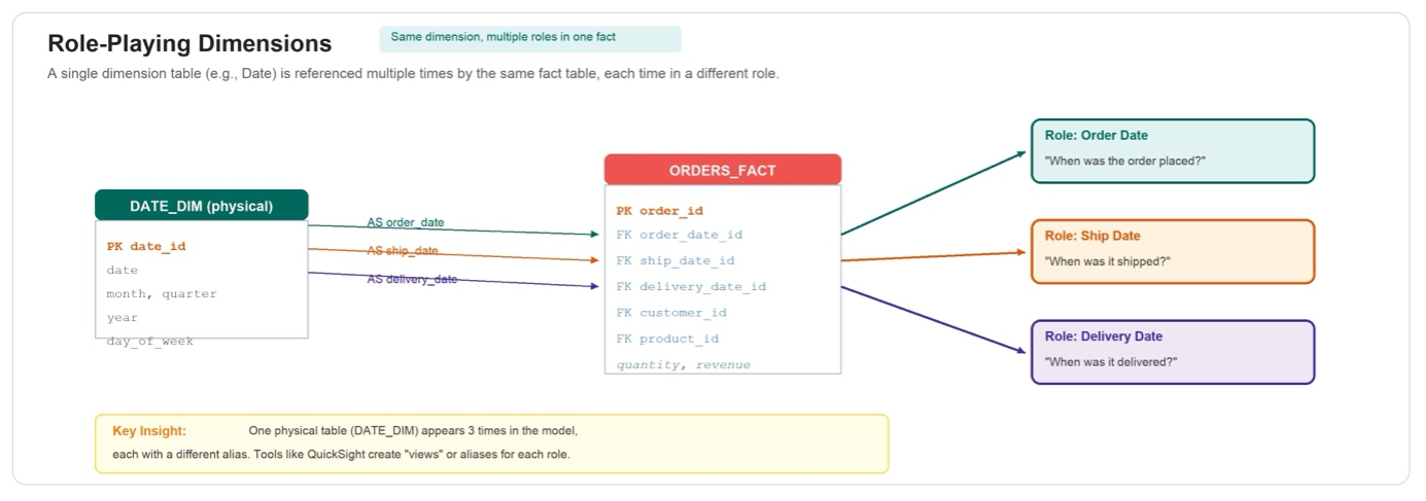
| Table | Type | Key Columns | Attributes |
| ORDERS_FACT | Fact | order_id (PK) order_date_id (FK) ship_date_id (FK) delivery_date_id (FK) customer_id (FK) product_id (FK) | quantity revenue |
| DATE_DIM | Role-Playing Dim (1 physical table) | date_id (PK) | date month, quarter, year day_of_week is_weekend, is_holiday |
| CUSTOMER_DIM | Dimension | customer_id (PK) | name, email city, state, segment |
| PRODUCT_DIM | Dimension | product_id (PK) | product_name category, brand |
Use cases
- Seasonal demand: orders placed in December versus items delivered in January.
- Average days between order and shipment (ship lag analysis).
- Delivery performance by month: how many orders were delivered on time?
Implementation
- Create one physical table: DATE_DIM with all date attributes.
- In the fact table, add one FK per role:
- In Quick Sight, create three separate datasets for the roles of the date dimension, all based on the same underlying source Date_Dim table.
- Note: In SQL, the engine uses table aliases in JOINs to differentiate each role.
- Do not duplicate the physical table in the underlying data source.
The role mapping is defined in the following table.
| FK in Fact Table | Role / Alias | Business Question |
| order_date_id | OrderDate | When was the order placed? |
| ship_date_id | ShipDate | When was it shipped? |
| delivery_date_id | DeliveryDate | When was it delivered? |
Sample query
Average ship lag by product category:
Scenario 5: Multi-fact with different grain
Two or more fact tables at different levels of detail (grain) share common dimension tables. Quick Sight Multi-Dataset runtime joins automatically aggregate the finer-grained fact up to the coarser grain before joining. This eliminates the need for manual pre-aggregation in extract, transform, and load (ETL) pipelines.
Daily sales and monthly forecasts share dimensions at different grain levels.
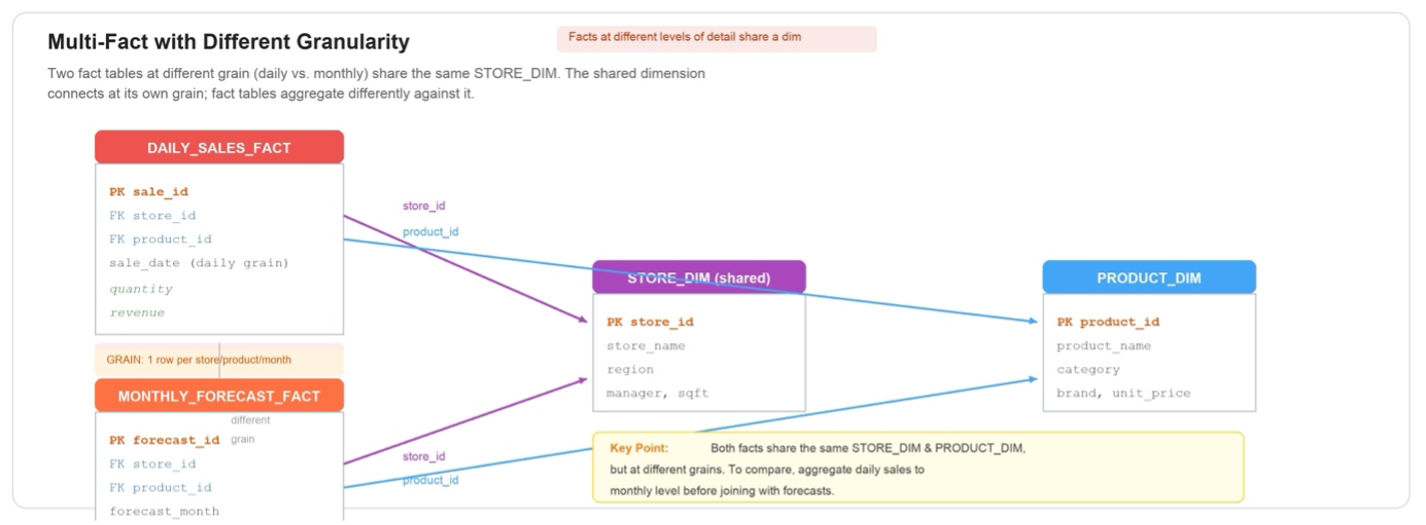
| Table | Type / Grain | Key Columns | Attributes/Measures |
| DAILY_SALES_FACT | Fact Grain: 1 row per store/product/day | sale_id (PK) store_id (FK) product_id (FK) sale_date | quantity revenue |
| MONTHLY_FORECAST_FACT | Fact Grain: 1 row per store/product/month | forecast_id (PK) store_id (FK) product_id (FK) forecast_month | forecast_revenue forecast_quantity |
| STORE_DIM | Shared Dim | store_id (PK) | store_name, region manager, sqft |
| PRODUCT_DIM | Shared Dim | product_id (PK) | product_name category, brand unit_price |
Sample query
Actual versus forecast by store (monthly):
Scenario 6: Independent refresh schedules
The preceding scenarios demonstrate how different schema patterns map to Multi-Dataset Relationships. The next two scenarios shift focus from data modeling structure to operational capabilities of the multi-dataset architecture: independent refresh schedules and runtime row-level security.
Because each dataset in a Multi-Dataset Topic is an independent entity, datasets can be refreshed on separate schedules tailored to their data volatility. High-velocity fact tables can refresh hourly, and slowly changing dimensions can refresh daily or weekly.
| Dataset Type | Suggested Cadence | Example |
| Transaction facts (orders, clicks) | Every hour | ORDERS_FACT, PAGEVIEWS_FACT |
| Aggregated/summary facts | Daily | DAILY_SALES_SUMMARY |
| Dimension tables | Weekly or on-change | CUSTOMER_DIM, PRODUCT_DIM |
| Reference/lookup tables | Monthly or ad-hoc | REGION_DIM, CATEGORY_DIM |
- Configure each dataset with its own SPICE refresh schedule independently.
- Use incremental refresh on fact tables where supported to minimize SPICE costs.
- Monitor SPICE capacity separately per dataset. Each refresh is an independent ingestion job.
Scenario 7: Row-level security at runtime
Multi-Dataset Relationships enforce row-level security (RLS) rules during runtime joins. Each dataset’s RLS policies are respected independently, so users see only the data they are authorized to access, even when queries span multiple datasets. This is a key advantage over composite datasets, which cannot enforce the parent dataset’s RLS.
Use cases
- Regional sales managers see only their region’s data when querying across facts and dimensions.
- Department-level access control on shared dimension tables (for example, HR data visible only to HR).
- Multi-tenant analytics where each customer sees only their own records across all datasets.
- Compliance scenarios requiring strict data isolation across business units.
Implementation
- Define RLS rules on each dataset independently (for example, filter SALES_FACT by region, filter CUSTOMER_DIM by segment).
- At query time, the runtime join engine applies each dataset’s RLS before performing the join.
- Users querying across datasets receive only the intersection of rows they are permitted to see in each table.
- No additional configuration is needed at the Topic level. RLS propagates automatically from each dataset.
RLS is applied before the join, not after. This means users see the intersection of their permitted rows from each dataset, which is a stricter and more secure model than post-join filtering.
Supported with workarounds
The following patterns are not natively supported but can be addressed with data modeling workarounds applied in the dataset preparation layer.
Circular/loop joins → break the cycle
A circular relationship exists when two paths lead from the same fact to the same dimension (for example, Order → Branch AND Order → Sales Staff → Branch). Circular relationships are not supported. The solution is to remove one leg and denormalize the redundant path.
A triangular join cycle that must be broken to avoid ambiguity.
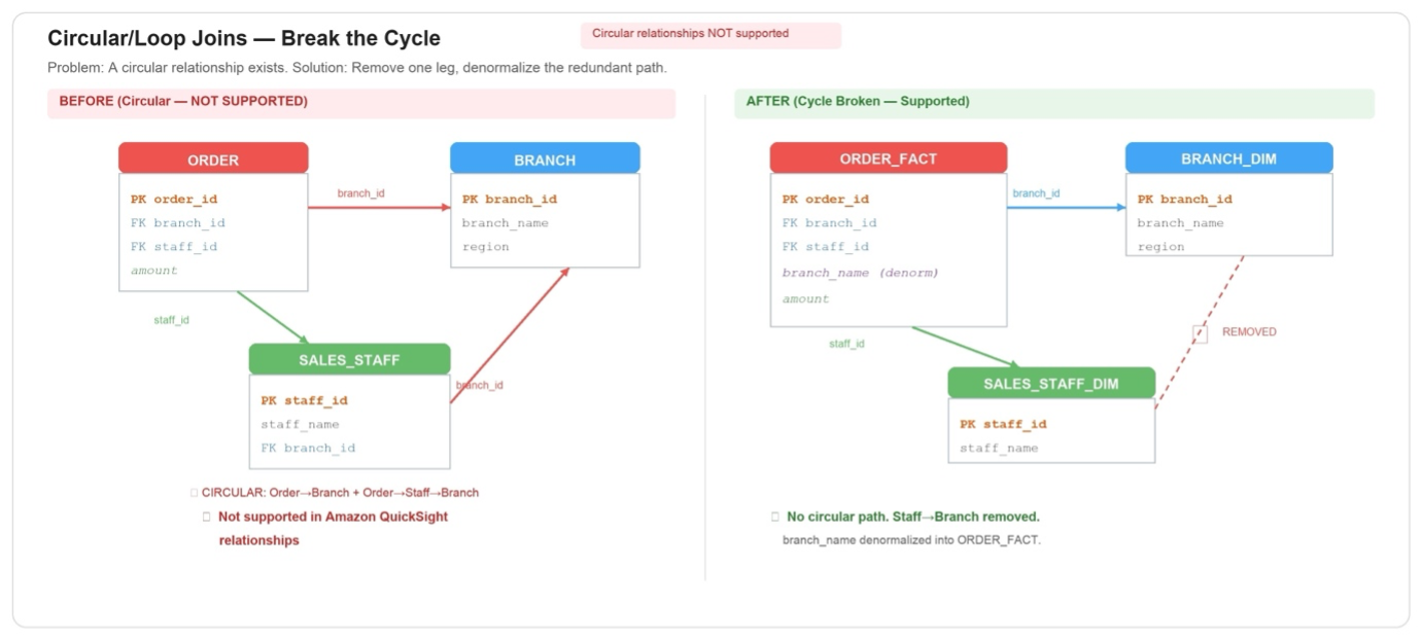
Problem (not supported out of box)
Order → Branch (direct FK) AND Order → Sales Staff → Branch (indirect path via Staff). This creates a triangular loop. If your model creates a cycle (A → B → C → A), you must break it before defining relationships in the Topic. Quick Sight will reject relationship definitions that form a loop.
Solution
- Remove one leg of the circle. Determine the primary analytical path and preserve that relationship.
- Remove the Sales Staff → Branch relationship from the Topic definition.
- Optionally denormalize the removed dimension’s key attributes into the fact dataset.
- Remaining relationships (no cycle): ORDER_FACT.branch_id → BRANCH_DIM and ORDER_FACT.staff_id → SALES_STAFF_DIM.
The new table structure after the workaround is applied.
| Table | Type | Key Columns | Attributes/Measures |
| ORDER_FACT | Fact | order_id (PK) branch_id (FK) staff_id (FK) |
branch_name (denormalized) amount |
| BRANCH_DIM | Dimension | branch_id (PK) |
branch_name region |
| SALES_STAFF_DIM | Dimension (no branch_id!) | staff_id (PK) |
staff_name hire_date |
Staff performance by branch (after fix)
Recursive hierarchies → flatten
An employee table with a MANAGER_ID column referencing back to the same table (org chart). Self-joins are not supported across datasets.
Solution 1 — Separate manager dimension
Create a copy of the employee table as a “Manager” dimension dataset. Good for single-level hierarchy (employee → direct manager only).
Solution 2 — Flattened hierarchy table (recommended)
Pre-compute a flattened hierarchy view with explicit level columns (Level1_VP, Level2_Director, Level3_Manager, Employee). Import as a single Quick Sight dataset.
Ragged hierarchies → pad/repeat parent values
Geographic hierarchy where some countries have states and cities, but others go directly from country to city. Missing levels cause gaps in drill-downs.
Solution
In the ETL/dataset layer, pad missing levels by repeating the parent value so each path has uniform depth:
| Country | State | City | Note |
| USA | California | San Francisco | Normal depth |
| Singapore | Singapore | Singapore | State = City = Country (padded) |
| UK | England | London | Normal depth |
Split/parallel hierarchies → multiple dimensions
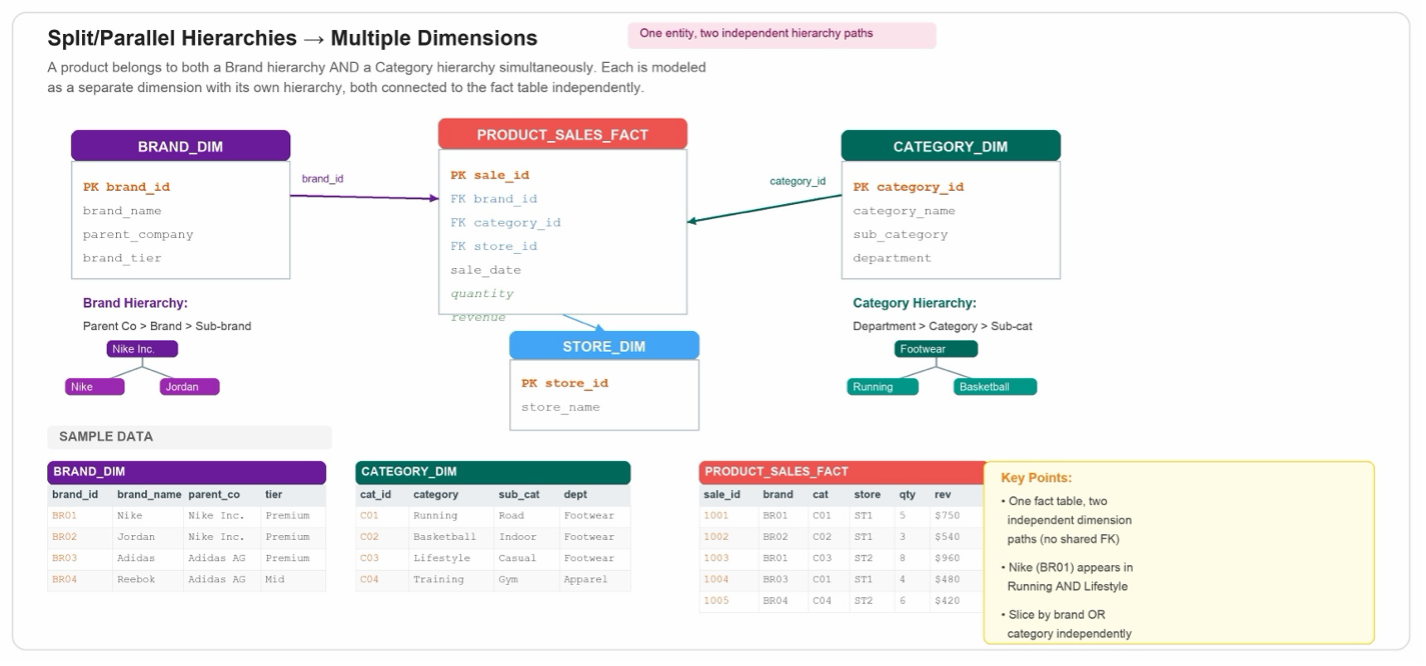
When an entity belongs to two or more independent hierarchies simultaneously (for example, a Product has both a Brand hierarchy and a Category hierarchy), model each as a separate dimension connected to the fact table independently.
Brand and category exist as independent dimension hierarchies.
Problem
A product belongs to both a Brand hierarchy (Nike Inc. > Nike > Air Max) and a Category hierarchy (Footwear > Running > Road). These hierarchies are independent. Combining them into one dimension creates a false dependency.
Solution
- Create separate dimension tables for each hierarchy path.
- Relate both dimensions to the fact independently:
- Users can slice by Brand OR Category independently without interference.
Sample query
Cross-analysis: Brand x Category matrix
Current limitations
Although the preceding workarounds address many advanced modeling needs, there are constraints in the current release that cannot be resolved through data modeling alone.
| Limitation | Description | Impact |
| Inner join only | Only inner join supported. Rows without matching keys are excluded. | Cannot analyze unmatched records |
| No circular joins | Relationship graph must be acyclic (DAG). | Must break cycles via denormalization |
| No outer joins | Left, right, and full outer joins not available. | Limits “all X including those without Y” queries |
| No self-relationships | A dataset cannot relate to itself. | Recursive hierarchies must be flattened |
| No SPICE + DQ mix | All datasets in a Topic must use the same query mode (SPICE or Direct Query). | Choose one mode per Topic |
| 12 dataset limit | Topic cannot exceed 12 datasets. | Large snowflakes may need consolidation |
| Limited DQ sources | Direct Query supports Amazon Redshift, Amazon Athena, Amazon S3 Tables, Snowflake, and Databricks only. | Other sources must use SPICE |
| JSON-only relationships | Composite keys require JSON upload (not UI). | Extra step for multi-column keys |
Conclusion
Multi-dataset runtime joins move Quick Sight from “flatten everything first” to “model once, combine at query time.” Keep each table as a dataset, declare relationships in a Topic, and let Quick Sight assemble inner joins on demand across visuals, calculations, filters, and Chat.
Star and snowflake schemas, single-conformed-dimension multi-fact analysis, and role-playing dimensions are supported directly. Loops, many-to-many, deep hierarchies, and outer-join retention are reachable through bridge tables, flattening, conforming to a spine, and pre-built joins. A small number of cases remain out of scope for now: true cycles and full outer-join semantics.
Start by modeling one fact and its dimensions, enrich the Topic metadata, validate with Chat, and grow the model outward. The same set of related datasets will then answer far more questions than any single flattened dataset could.
About the authors