Business intelligence analysts routinely face the same challenge at the start of every analytics project: the data needed to answer a single business question lives across multiple tables. Sales transactions sit in one place, customer demographics and product attributes in another, while returns, forecasts, and operational metrics occupy still others.
Until now, combining these tables in Amazon Quick Sight required pre-joining everything into wide, denormalized datasets before any analysis could begin. That approach works. But it forces data-modeling decisions up front, duplicates measures across different grains, introduces maintenance overhead, and typically produces a different dataset for almost every reporting scenario.
Today, we are excited to announce Multi-Dataset Relationships in Amazon Quick Sight. This new capability lets you define logical relationships between Quick Sight datasets and perform runtime joins at query time. Instead of flattening tables ahead of time, you keep each table as its own Quick Sight dataset and declare how those datasets relate to one another inside a Quick Sight Topic. Quick Sight then assembles precisely the join it needs for visuals, calculated fields, filters, or natural-language Q&A.
This paradigm shift brings several key advantages:
- Less upfront data preparation — Define relationships once. Quick Sight joins only the relevant tables at analysis time.
- Preserved native granularity — Each dataset maintains its own level of detail, avoiding measure duplication across grains.
- Reuse across analyses — A single Topic with defined relationships serves multiple analytical use cases without rebuilding datasets.
- Simplified governance — Manage permissions, transformations, and business logic at the individual dataset level.
- Independent refresh schedules — Ingest data per table at different cadences (hourly, daily, monthly) based on data volatility.
- Row-level security at runtime — Row-level security (RLS) rules are enforced during runtime joins, so data-access policies apply consistently across datasets.
In this post, we cover data modeling concepts, supported patterns, and best practices for designing your multi-dataset data model in Quick Sight. For a deep dive into each schema pattern with SQL examples and advanced workarounds, see the second post in this series: Data Modeling Patterns for Amazon Quick Sight Multi-Dataset Relationships [link].
Why a runtime, relationship-based model
The traditional single-dataset model has three recurring costs:
- Upfront preparation: You must decide the join shape before you know every question, often pushing logic into custom SQL or database views.
- Measure duplication: When you join a fact table to a higher-grain dimension, measures on the “one” side get replicated across the “many” side, inflating sums unless you carefully de-duplicate.
- Dataset sprawl: Each analytical scenario tends to spawn its own purpose-built flat dataset, multiplying maintenance.
A relationship-based model addresses all three. You model the tables once, keep each at its native level of detail, and let the engine bring in only the tables a given visual actually needs.
Understanding the architecture
Multi-dataset relationships rely on two distinct modeling layers. Understanding how they differ helps you decide where each piece of logic belongs.
Two layers: Logical and physical
- Physical layer — inside a dataset. A single Quick Sight dataset is where you merge physical tables together with joins, unions, SQL, and transforms into one flattened result. Think of this as combining tables that share the same grain and always belong together.
- Logical layer — across datasets in a Topic. Each dataset behaves as one logical table. Inside a Topic you relate these logical tables to one another. They are not merged; they stay distinct and keep their own grain. Quick Sight only combines them when a visual, calculation, filter, or chat question requires fields from more than one.
| Concept | Quick Sight Implementation |
| Logical Table | A Quick Sight Dataset (can contain internal joins, transforms, calculated fields) |
| Relationship | Defined in a Quick Sight Topic between datasets via matching key columns |
| Runtime Join | Executed at query time when a visual or calculation references fields from multiple datasets |
| Data Model | The Quick Sight Topic — serves as the container for datasets + relationships |
How it works
- Create individual datasets. Each dataset represents a logical entity, such as Sales Facts, Customer Dimension, or Product Dimension.
- Create a Topic. The Topic acts as your semantic, logical data model container.
- Define relationships. Specify which columns link datasets together.
- Analyze. In analysis sheets, drag fields from multiple datasets, and Quick Sight performs runtime inner joins.
- Chat (Q&A). Ask natural language questions that span datasets, and Quick Sight uses relationships to generate cross-dataset queries.
Current release note: In the current release, relationships use inner join semantics. Rows must have matching keys in both datasets to appear in results.
Data modeling concepts
Before you design relationships, it helps to review the core building blocks of dimensional modeling.
Dimensional modeling
- Fact tables — Contain quantitative, measurable data (revenue, quantity, cost) at a specific grain. Fact tables are typically narrow and tall.
- Dimension tables — Contain descriptive attributes (customer name, product category, store location) that provide context. Dimension tables are typically wide and short.
| Schema | Description | When to Use |
| Star Schema | Single fact table surrounded by dimension tables, all directly connected | Simple, fast queries; recommended default |
| Snowflake Schema | Star schema with normalized (decomposed) dimension tables | Reducing redundancy in large dimensions |
| Galaxy / Constellation | Multiple fact tables sharing conformed dimensions | Cross-process analytics (Sales vs. Returns) |
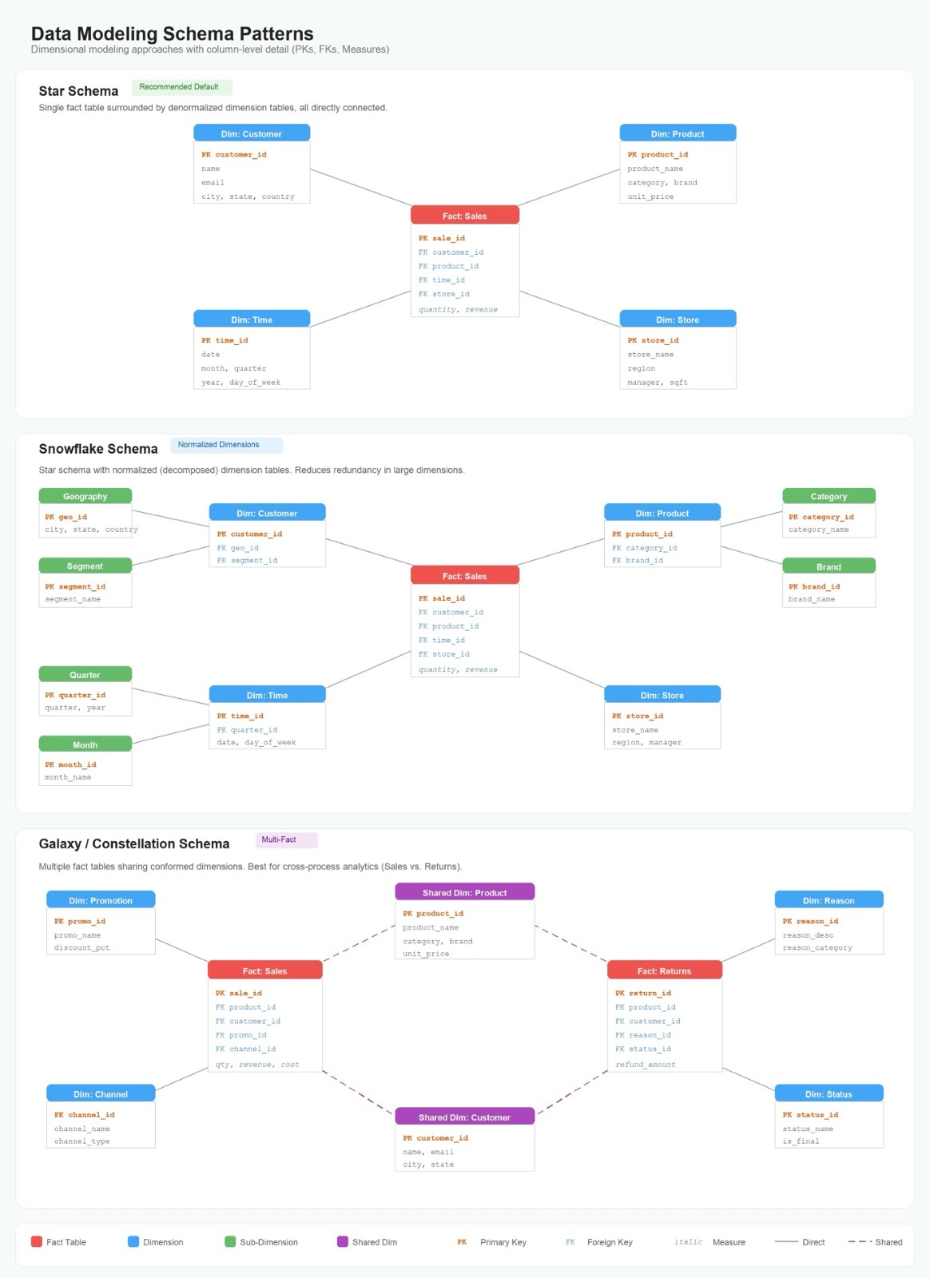
Star, Snowflake, and Galaxy/Constellation schema patterns
Hierarchy types in dimensions
| Hierarchy Type | Description | Example |
| Balanced (Fixed-depth) | Every branch has the same number of levels | Year > Quarter > Month > Day |
| Ragged (Variable-depth) | Branches have different depths; some levels skipped | Country > State > City (some have no State) |
| Recursive (Self-ref) | Table references itself via parent-child keys | Employee > Manager (org chart) |
| Split (Parallel) | Entity belongs to multiple independent hierarchies | Product has Brand and Category hierarchies |
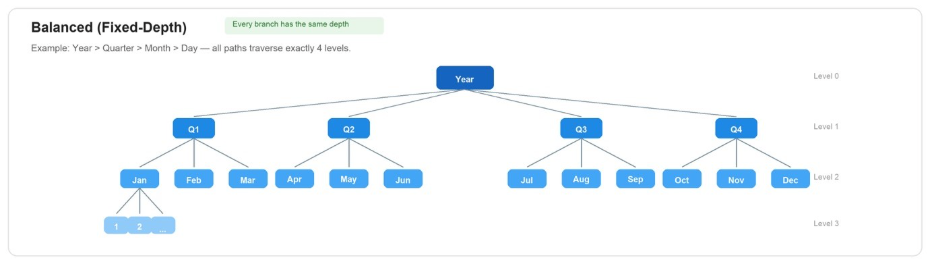
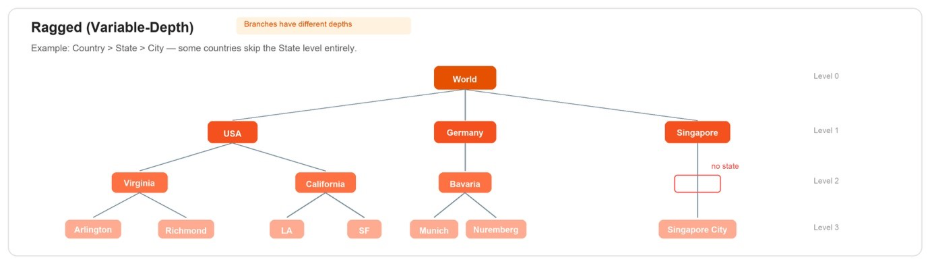
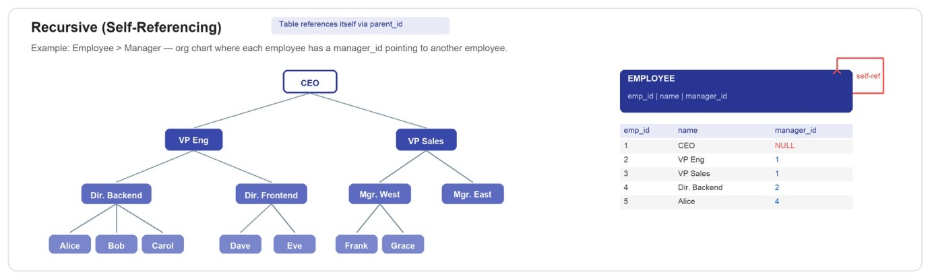
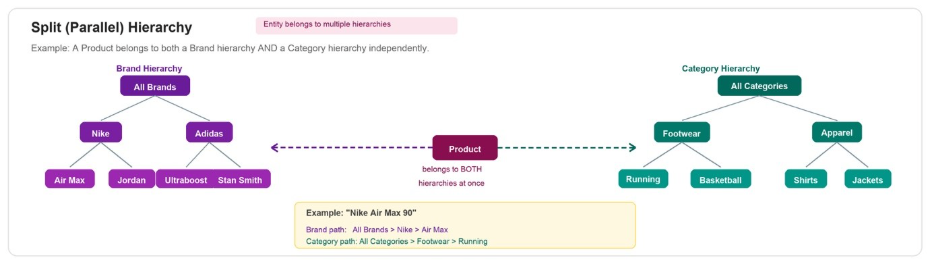

Balanced, Ragged, Recursive, and Split hierarchy type diagrams
Best practices
The following practices help you build a multi-dataset model that stays performant and maintainable as it grows.
1. Start with a star schema
The star schema is the recommended foundation: a central fact table as the hub dataset with dimension tables radiating outward. Star schemas minimize join complexity and maximize query performance.
2. Design datasets as logical tables
- One dataset = one business concept (Customers, Products, Orders).
- Pre-join snowflake chains into a single dimension dataset when feasible.
- Include surrogate keys for clean joins.
- Enrich with descriptions, synonyms, and semantic types.
3. Define clean join keys
- Use integer surrogate keys where possible (faster joins, smaller storage).
- Confirm matching data types on both sides of the relationship.
- Remove null values from join key columns (nulls never match in inner joins).
- Validate referential integrity. Every foreign key in the fact table should exist in the dimension.
4. Manage granularity deliberately
- All datasets related to the same fact should be joinable at a compatible grain.
- If a dimension is at a coarser grain, aggregate the fact to match.
- For multi-fact models, make sure shared dimensions have a single, consistent grain.
5. Enrich metadata for AI and natural language accuracy
Multi-Dataset Topics power Quick Sight’s natural language interface. Rich metadata dramatically improves accuracy:
- Add field descriptions explaining business meaning.
- Add synonyms (such as Revenue → Sales, Income, Total Amount).
- Set semantic types (City, Currency, Date, and so on).
- Add custom instructions for business rules.
- Exclude internal/technical columns users don’t need.
6. Handle multi-fact scenarios carefully
- Confirm shared dimensions have a conformed grain across all facts.
- Be explicit about which relationships exist, and avoid creating unnecessary connections.
- Test cross-fact calculations to verify correct aggregation.
7. Plan for growth
- Start with a focused model (1 fact + key dimensions). Add datasets gradually.
- Document your data model by keeping a diagram of datasets and relationships.
- Use naming conventions:
FACT_*,DIM_*,BRIDGE_*.
Decision framework: When to use multi-dataset vs. pre-joined
The preceding best practices provide a general framework for designing robust multi-dataset models. However, not every analytics scenario calls for multi-dataset relationships. The following decision framework helps you determine when to use runtime relationships versus the traditional pre-joined dataset approach.
| Scenario | Recommended Approach |
| Simple analysis with < 5 tables and only 1 fact table | Single pre-joined dataset (traditional) |
| Multiple analysts asking different questions on different fact tables | Multi-Dataset Relationships |
| Need outer join behavior | Single pre-joined dataset (or wait for future release) |
| Natural language or chat-powered exploration | Multi-Dataset Relationships with dataset and topic enrichment |
| Many-to-many without a bridge table | Multi-Dataset Relationships |
| Role-playing dimensions | Multi-Dataset Relationships (separate datasets per role) |
Getting started
To get started read Build a unified semantic layer across datasets with multi-dataset Topics in Amazon Quick.
Next: Schema patterns and advanced workarounds
So far, we have covered the foundational concepts of dimensional modeling, including star, snowflake, and galaxy (constellation) schemas. We also covered general best practices for designing clean join keys, managing granularity, enriching metadata, and planning for growth.
In the second post, we shift from theory to practice. We walk through each schema pattern in detail with concrete table structures and sample SQL queries. We also show how to handle supported scenarios such as role-playing dimensions and multi-fact models with different granularity. And we explain workarounds for patterns that are not natively supported, including circular joins, recursive hierarchies, and ragged hierarchies.
Read Part 2: Data Modeling Patterns for Amazon Quick Sight Multi-Dataset Relationships
About the authors