If you’re operating AI agents at scale, Amazon Bedrock AgentCore surfaces a category of insights you’ve probably experienced but struggle to detect: your dashboards show green across the board. 99% completion rate, healthy latency, zero error spikes. And yet customer complaints trickle in about incorrect outcomes.
An order modification that was never actually executed. A product reported as “in stock” when the inventory API timed out. An approval step that was skipped. These are behavioral failures, and they look different from infrastructure issues. They complete successfully from the system’s perspective. They pass health checks and only surface through customer escalations, often weeks after they began affecting users at scale.
Even for failures that do produce error signals, a separate challenge exists: when an agent serving thousands of daily sessions accumulates hundreds of errors, which ones deserve attention first? Reviewing individual traces reveals what happened in a single session. But it tells you little about whether you’re looking at a pattern affecting 30% of traffic or an edge case affecting three sessions.
Amazon Bedrock AgentCore optimization provides insights that help you discover, explain, and prioritize behavioral failures in your deployed AI agents, including the silent ones that never generate an error signal. These insights shift the observability model from reactive trace inspection to proactive pattern detection. It helps you find the failures, understand their scope, and fix them in priority order. In this post, we walk through how insights in AgentCore optimization works, how to set it up, and what it reveals when pointed at a real agent.
What insights in Amazon Bedrock AgentCore optimization delivers
Insights operate one layer above your existing observability stack. It consumes the trace data your tools already collect and transforms it into actionable behavioral intelligence. This provides an investigation capability that helps you understand broader patterns affecting agent performance at scale, beyond individual session failures.
The following figure shows the end-to-end analysis performed by AgentCore to deliver insights. Each session analysis method extracts one or more attributes from each session. The attributes from each session analysis method are clustered independently. Each cluster is summarized to enhance interpretability.
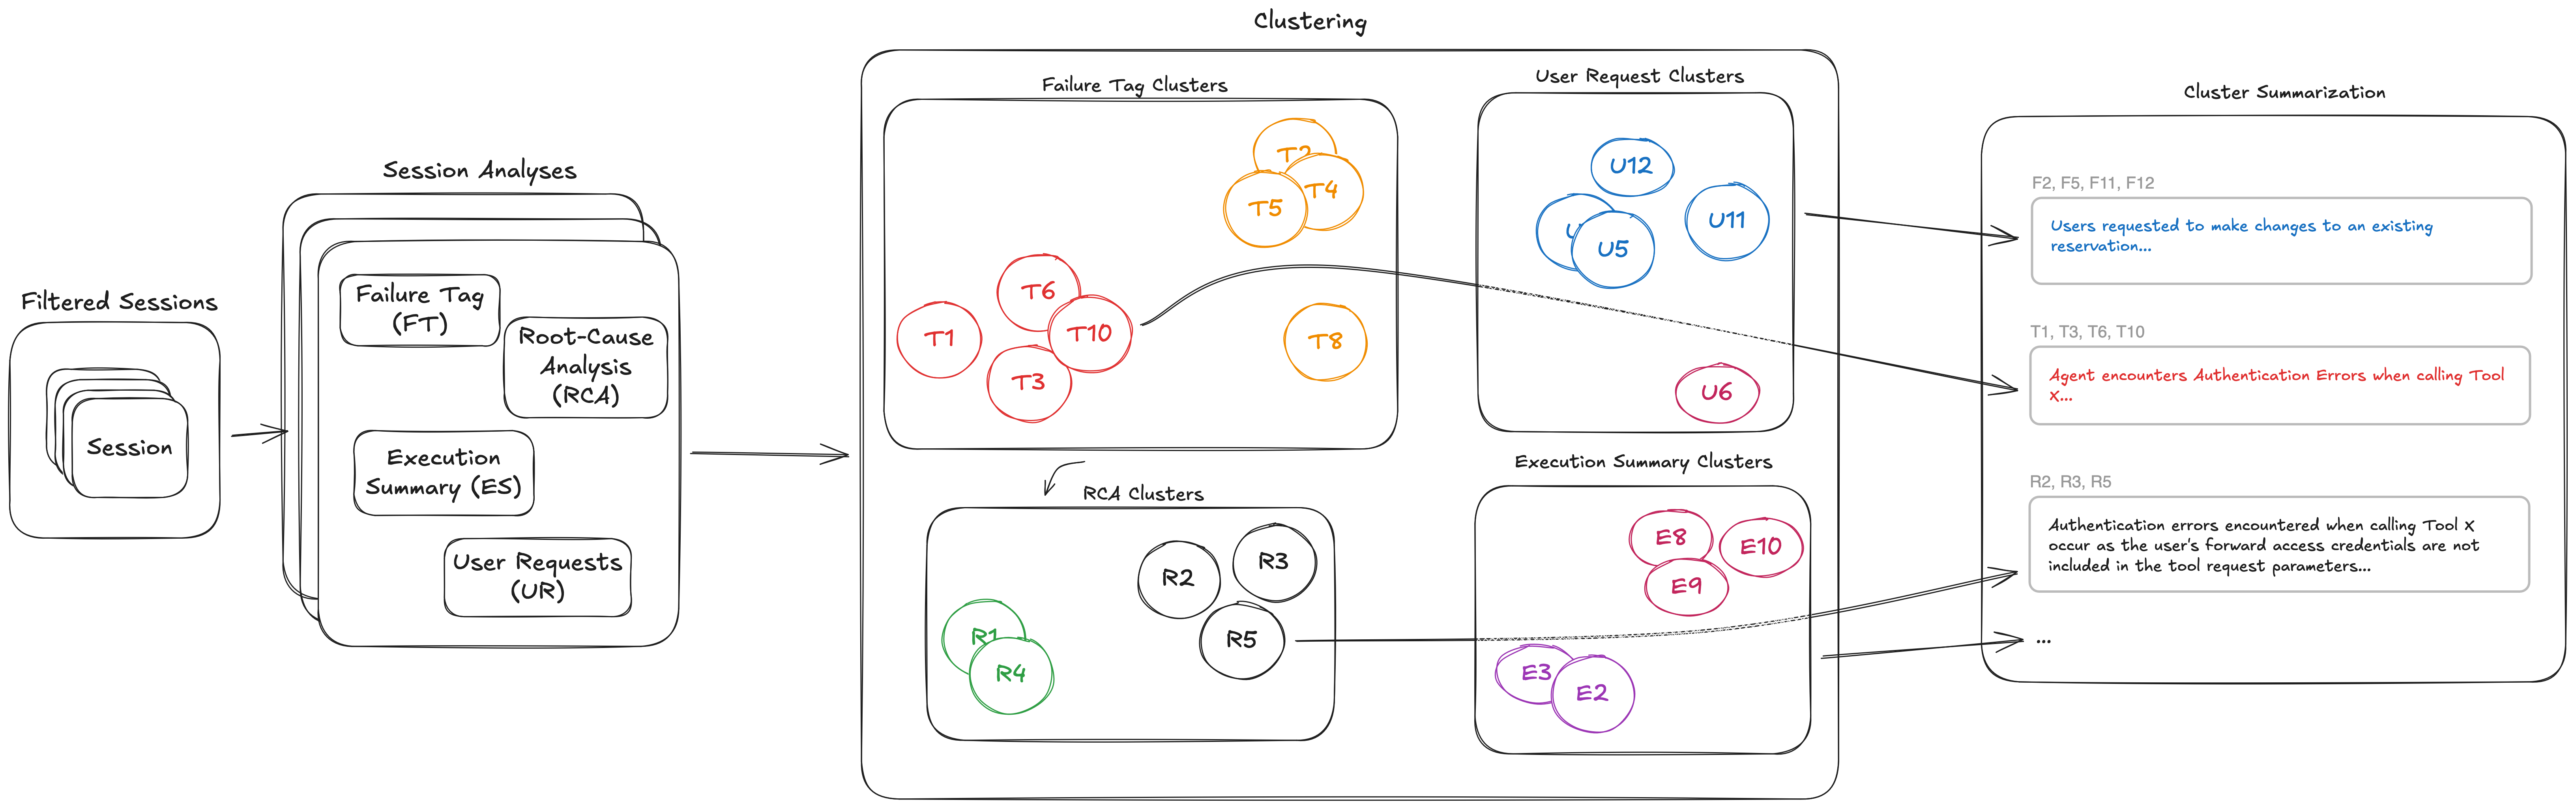
The insights report surfaces the following:
- Ranked failure pattern discovery with root cause analysis.
Surfaces ranked clusters across hundreds of sessions without requiring predefined categories or filters. One aggregate explanation per cluster covering affected sessions, specific enough to act on without opening individual traces. Patterns are ordered by proportion of sessions affected, so a pertinent issue is immediately distinguishable from an edge case. Without this, developers triage errors by gut feel and cannot distinguish a systematic issue without manually reviewing hundreds of traces.
- User intent analysis.
Reveals how users interact with the agent across different scenarios. Agents in production often receive requests that diverge from their intended design. Intent analysis shows you the actual distribution of what users ask for. It surfaces coverage gaps to address and scope boundaries to enforce, without requiring you to instrument anything beyond the traces you already collect.
- Execution insights.
Reveals how the agent responds across different scenarios. Execution insights show you the strategies your agent employs, how actions progress during a session, and where the agent’s real behavior diverges from your intended design. This closes the gap between “what we built the agent to do” and “what the agent actually does at scale.”
Let’s now see each capability in depth.
Failure pattern discovery
AgentCore analyzes each session trace against a structured taxonomy of behavioral failure types. It detects 11 categories including hallucination, incorrect actions, task instruction violations, orchestration errors, context handling issues, and others. The analysis reasons about policy compliance and behavioral correctness rather than relying on error signals alone. This approach detects silent failures. Each detected failure produces a location in the trace, a category, and a natural language description of what went wrong. Insights then group the descriptions into clusters. This surfaces a single named pattern across hundreds of sessions, rather than hundreds of individual trace entries.
The following figure shows the failure clustering and root cause analysis (RCA pipeline). We identify failures for each session, cluster them into sub-clusters. For each session in a failure sub-cluster, we produce root cause explanations.
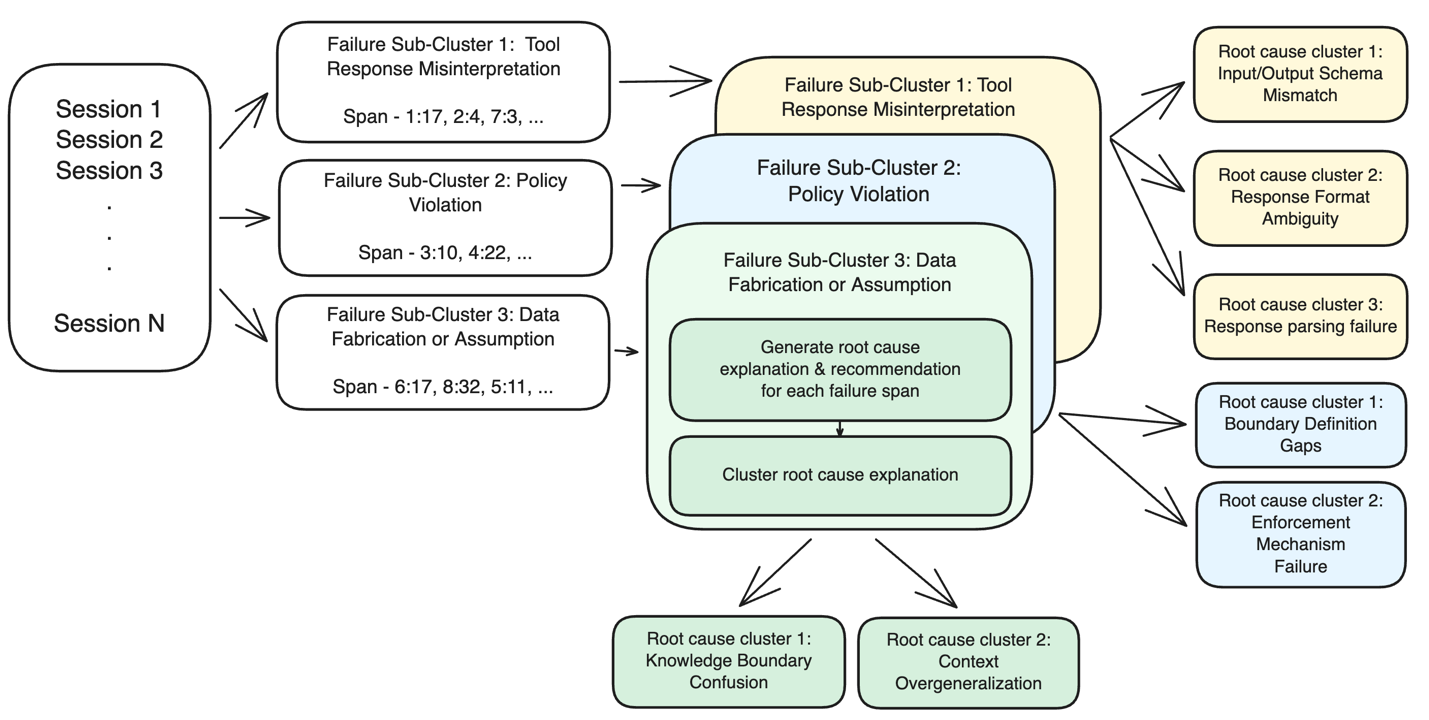
For each failure cluster, AgentCore traces backward through the execution graph to identify what caused the failure, not just where it appeared. The session is represented as a graph of spans (inference calls, tool executions, sub-agent invocations), and the system prunes branches unrelated to the failure before reasoning about causality. This pruning makes RCA tractable on long sessions by narrowing a 50-step workflow down to the specific execution path that led to the failure. The output surfaces a root cause location (a span ID in your logs), a causality classification, and a fix recommendation (system prompt change, tool description update, or infrastructure work). Insights then group root causes within a cluster. You might see that 90 of 100 failures share the same underlying cause and the same fix type.
Clustering alone tells you what kinds of failures exist. Scope ranking tells you which ones matter most. Each failure cluster carries a count of affected sessions, and clusters are ordered by that count relative to total sessions analyzed. The two-level hierarchy separates broad failure categories from specific sub-patterns.
A top-level cluster might show “Agent Bypasses Information Gathering” affecting 116 sessions. Drilling in reveals that 114 of those are a single sub-pattern (“Skipped Prerequisite Information Retrieval”). The remaining 2 are unrelated edge cases. This structure means you can immediately identify the single fix that addresses the largest share of failures.
User intent analysis
Beyond failures, AgentCore extracts two additional views of agent behavior. User request clustering embeds and groups the actual prompts users send to your agent, revealing the distribution of use cases in production. You may discover that 40% of traffic is a use case you designed for. Another 30% is partially supported. The remaining 30% is something you never anticipated.
Execution insights
Execution summary extracts the approach the agent took and the outcome it reached for each session. It uses a hierarchical summarization strategy that handles sessions of varying lengths. AgentCore then clusters these summaries to reveal execution patterns. This includes common strategies the agent employs, how those strategies correlate with success or failure, and where the agent’s actual behavior diverges from your intended design.
Together, these give you a behavioral map of your agent in production that goes beyond error detection into understanding how the system is being used and how it responds.
How to set up insights in Amazon Bedrock AgentCore optimization
When you have an agent with its telemetry recorded in Amazon Bedrock AgentCore observability, you can use insights to understand failure modes, user intents and execution summaries of this agent.
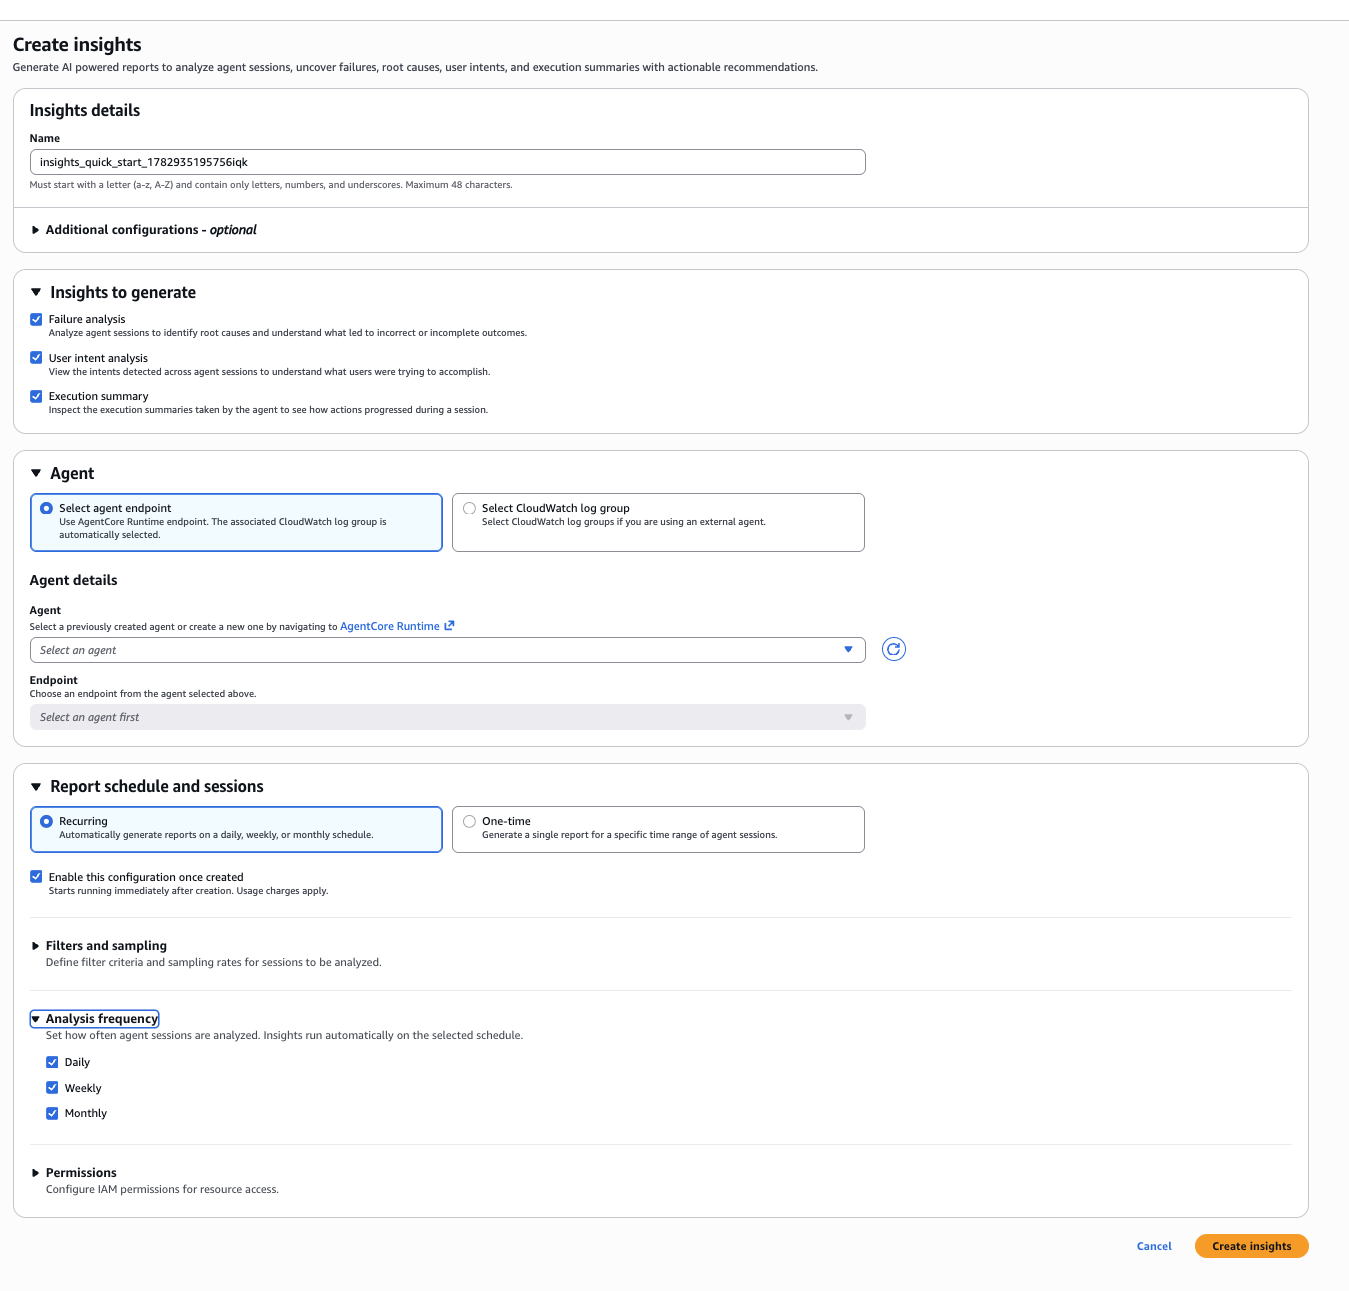
You can create an insights configuration from the AgentCore console under Optimizations > Insights > Create Insights.
Choose what to analyze
Under “Insights to generate,” select the analysis types you want:
- Failure analysis: identifies root causes and surfaces incorrect or incomplete outcomes across sessions.
- User intent analysis: clusters the requests users are sending to your agent so you can see what they are trying to accomplish.
- Execution summary: extracts the actions the agent took during each session and how they progressed toward a resolution.
You can run them independently or together.
Connect your agent
You have two options for pointing insights at your session data:
- Select agent endpoint: choose an agent deployed through AgentCore runtime, and the associated Amazon CloudWatch log group is selected automatically.
- Select Amazon CloudWatch log group: if your agent runs outside AgentCore runtime, point directly to the log group where your traces land.
Set a schedule
Insights can be set up in two modes:
Recurring generates reports automatically on a cadence you choose. You can enable a combination of daily, weekly, and monthly analysis frequencies. Once created, insights processes sessions in the background with no further action required.
One-time generates a single report for a specific time range. Use this for post-deployment reviews, complaint-driven investigations, or metric anomalies you want to explain.
The “Enable this configuration once created” checkbox (checked by default) starts processing immediately after you save.
Optional: Filters, sampling, and permissions
Expand “Filters and sampling” to scope analysis to specific session criteria or sample a subset of traffic. Expand “Permissions” to configure the IAM role insights uses to access your logs.
Once configured, choose Create Insights and your first report will be available based on the schedule you chose.
Seeing insights in action
Consider a market trends agent that provides investment analysis, stock recommendations, and sector performance data. After running 10 sessions, here is what each insight analysis view surfaces.
Failure analysis
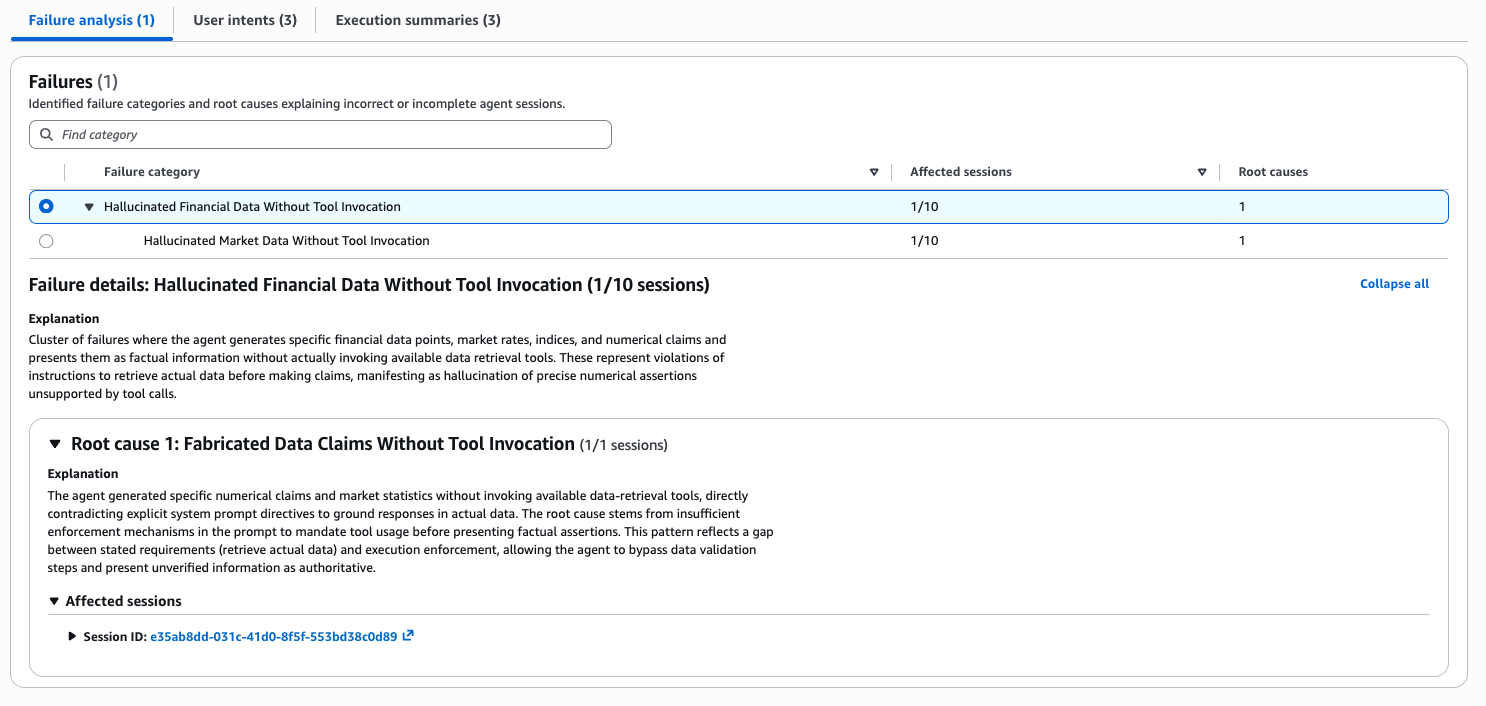
Insights identified one failure category: “Hallucinated Financial Data Without Tool Invocation,” affecting 1 out of 10 sessions. The agent generated specific financial data points, market rates, and numerical claims and presented them as factual information without invoking available data retrieval tools. This violates the system prompt directive to retrieve actual data before making claims.
The root cause (“Fabricated Data Claims Without Tool Invocation”) traces this to a gap between stated requirements and execution enforcement. The system prompt tells the agent to ground responses in actual data but lacks sufficient enforcement mechanisms to mandate tool usage before presenting factual assertions. The agent bypasses data validation steps and presents unverified information as authoritative.
This failure produced no error. The session completed successfully. With insights, you see the root cause, the specific session affected, and a clear path to fix: strengthen the system prompt to enforce tool invocation before numerical claims.
User intent analysis
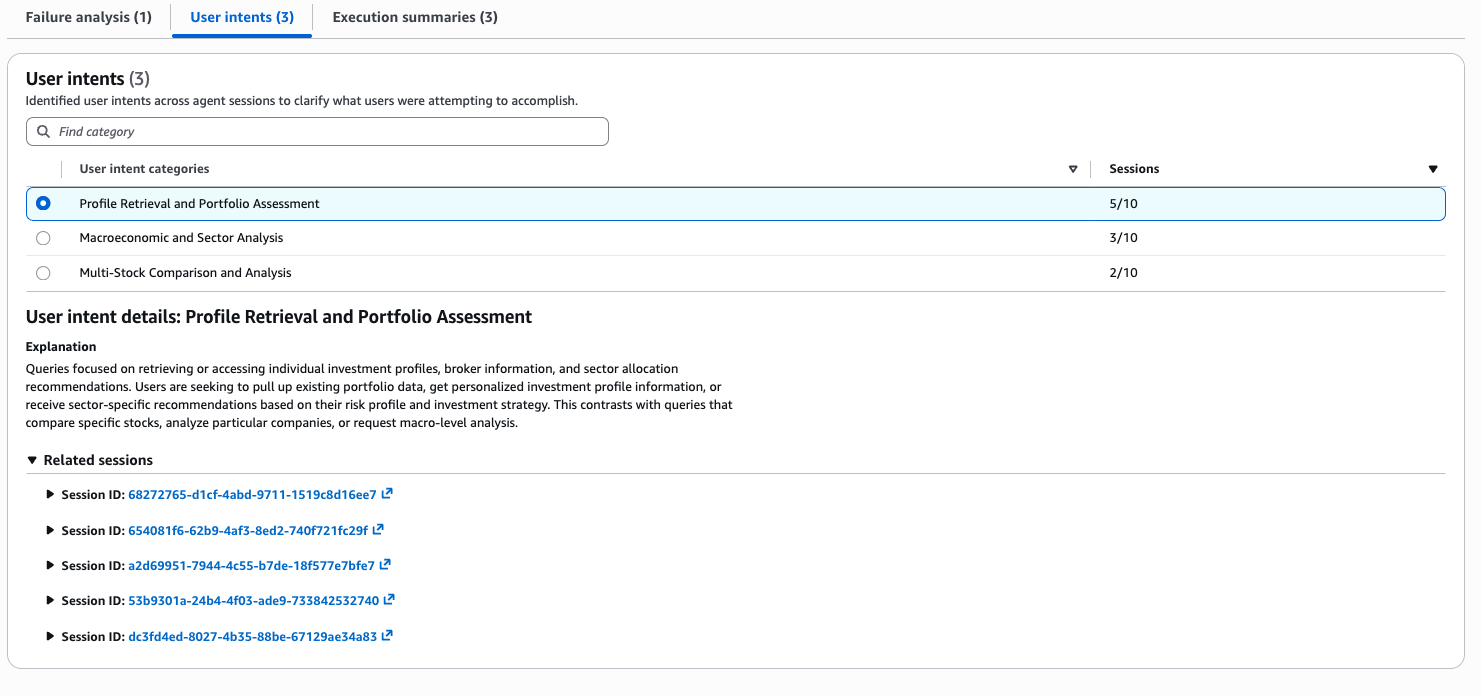
Understanding what users ask your agent to do normally requires manually reading session transcripts. Intent analysis gives you this distribution automatically from the traces you already collect. User requests here are clustered into 3 categories, revealing the actual distribution of what users ask the agent to do:
- Profile Retrieval and Portfolio Assessment (5/10 sessions): users pulling up existing portfolio data, requesting personalized investment profile information, or seeking sector-specific recommendations based on their risk profile.
- Macroeconomic and Sector Analysis (3/10 sessions): users asking about broader market conditions and sector-level trends.
- Multi-Stock Comparison and Analysis (2/10 sessions): users comparing specific stocks against each other.
Half of all traffic is profile and portfolio retrieval. This tells you where to invest in reliability first. If profile lookups fail or return stale data, you are degrading the experience for 50% of your users.
Execution summaries
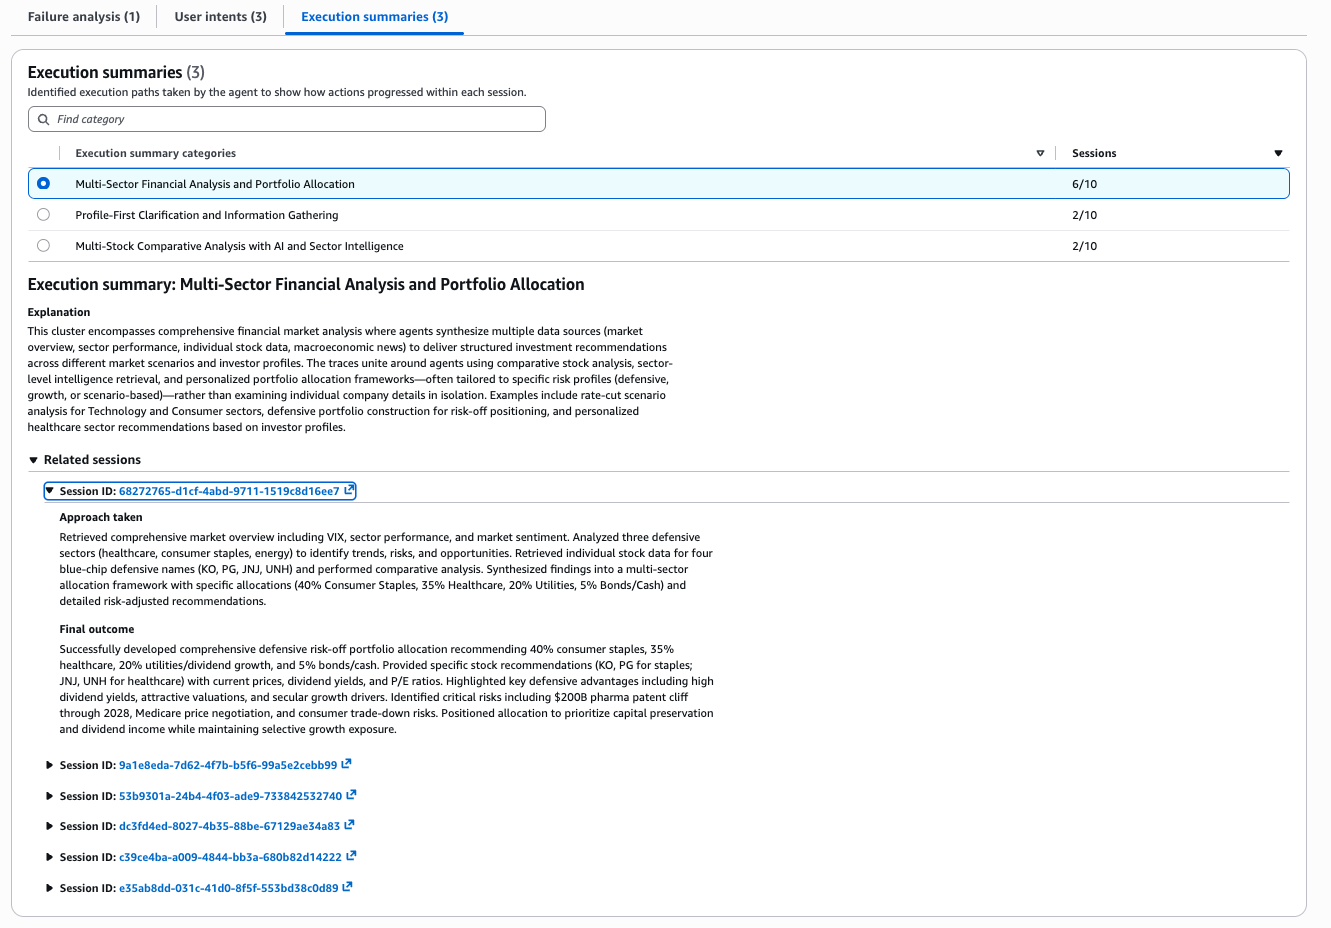
You know what your agent was designed to do but have limited visibility into what it does across sessions at scale. Execution summaries close that gap. Here the market agent behavior is grouped into three execution patterns:
- Multi-Sector Financial Analysis and Portfolio Allocation (6/10 sessions): the agent retrieves market overview data (VIX, sector performance, sentiment), analyzes defensive sectors, pulls individual stock data for blue-chip names (KO, PG, JNJ, UNH), and synthesizes a multi-sector allocation framework with specific percentage allocations and risk-adjusted recommendations.
- Profile-First Clarification and Information Gathering (2/10 sessions): the agent prioritizes understanding the user’s profile before acting.
- Multi-Stock Comparative Analysis with AI and Sector Intelligence (2/10 sessions): the agent compares multiple stocks with sector-level context.
The dominant execution pattern shows the agent completing full advisory workflows end-to-end. The two smaller patterns reveal alternative behavioral paths.
Conclusion
Amazon Bedrock AgentCore optimization provides insights when your agent is silently wrong. Use it for post-deployment validation when complaints spike but dashboards look normal. Perform proactive weekly monitoring that catches invisible failures before customers do. Use it for scope ranking assessment when a handful of complaints turns out to be less than 10% of actual impact. Whether you are validating a system prompt change against a time window, or tracing complaints back to affected sessions, the workflow is the same: submit sessions, receive ranked patterns, act on specific root causes. Enable insights in Amazon Bedrock AgentCore optimization for your agent and see what your dashboards are missing. Visit the documentation to learn more.
Acknowledgements: Thank you to the science and engineering team that delivered this capability: Sanjana Agarwal, Abhimanyu Siwach, Vincent Chen, Swarnim, Frankie Kim, Stephanie Yuan, Aron Thakur, Jaejin Cho, Muhyun Kim, Arron Bailiss, Shoaib Javed, Gitika Jha and Michael Fan.
About the authors