Running machine learning (ML) models in production requires more than just infrastructure resilience and scaling efficiency. You need nearly continuous visibility into performance and resource utilization. When latency increases, invocations fail, or resources become constrained, you need immediate insight to diagnose and resolve issues before they impact your customers.
Until now, Amazon SageMaker AI provided Amazon CloudWatch metrics that offered useful high-level visibility, but these were aggregate metrics across all instances and containers. While helpful for overall health monitoring, these aggregated metrics obscured individual instance and container details, making it difficult to pinpoint bottlenecks, improve resource utilization, or troubleshoot effectively.
SageMaker AI endpoints now support enhanced metrics with configurable publishing frequency. This launch provides the granular visibility needed to monitor, troubleshoot, and improve your production endpoints. With SageMaker AI endpoint enhanced metrics, we can now drill down into container-level and instance-level metrics, which provide capabilities such as:
- View specific model copy metrics. With multiple model copies deployed across a SageMaker AI endpoint using Inference Components, it’s useful to view metrics per model copy such as concurrent requests, GPU utilization, and CPU utilization to help diagnose issues and provide visibility into production workload traffic patterns.
- View how much each model costs. With multiple models sharing the same infrastructure, calculating the true cost per model can be complex. With enhanced metrics, we can now calculate and associate cost per model by tracking GPU allocation at the inference component level.
What’s new
Enhanced metrics introduce two categories of metrics with multiple levels of granularity:
- EC2 Resource Utilization Metrics: Track CPU, GPU, and memory consumption at the instance and container level.
- Invocation Metrics: Monitor request patterns, errors, latency, and concurrency with precise dimensions.
Each category provides different levels of visibility depending on your endpoint configuration.
Instance-level metrics: available for all endpoints
Every SageMaker AI endpoint now has access to instance-level metrics, giving you visibility into what’s happening on each Amazon Elastic Compute Cloud (Amazon EC2) instance in your endpoint.
Resource utilization (CloudWatch namespace: /aws/sagemaker/Endpoints)
Track CPU utilization, memory consumption, and per-GPU utilization and memory usage for every host. When an issue occurs, you can immediately identify which specific instance needs attention. For accelerator-based instances, you will see utilization metrics for each individual accelerator.
Invocation metrics (CloudWatch namespace: AWS/SageMaker)
Track request patterns, errors, and latency by drilling down to the instance level. Monitor invocations, 4XX/5XX errors, model latency, and overhead latency with precise dimensions that help you pinpoint exactly which instance experienced issues. These metrics help you diagnose uneven traffic distribution, identify error-prone instances, and correlate performance issues with specific resources.
Container-level metrics: for inference components
If you’re using Inference Components to host multiple models on a single endpoint, you now have container-level visibility.
Resource utilization (CloudWatch namespace: /aws/sagemaker/InferenceComponents)
Monitor resource consumption per container. See CPU, memory, GPU utilization, and GPU memory usage for each model copy. This visibility helps you understand which inference component model copies are consuming resources, maintain fair allocation in multi-tenant scenarios, and identify containers experiencing performance issues. These detailed metrics include dimensions for InferenceComponentName and ContainerId.
Invocation metrics (CloudWatch namespace: AWS/SageMaker)
Track request patterns, errors, and latency at the container level. Monitor invocations, 4XX/5XX errors, model latency, and overhead latency with precise dimensions that help you pinpoint exactly where issues occurred.
Configuring enhanced metrics
Enable enhanced metrics by adding one parameter when creating your endpoint configuration:
response = sagemaker_client.create_endpoint_config(
  EndpointConfigName='my-config',
  ProductionVariants=[{
    'VariantName': 'AllTraffic',
    'ModelName': 'my-model',
    'InstanceType': 'ml.g6.12xlarge',
    'InitialInstanceCount': 2
  }],
  MetricsConfig={
    'EnableEnhancedMetrics': True,
    'MetricsPublishFrequencyInSeconds': 10, # Default 60s
  })
Choosing your publishing frequency
After you’ve enabled enhanced metrics, configure the publishing frequency based on your monitoring needs:
Standard resolution (60 seconds): The default frequency provides detailed visibility for most production workloads. This is sufficient for capacity planning, troubleshooting, and optimization, while keeping costs manageable.
High resolution (10 or 30 seconds): For critical applications needing near real-time monitoring, enable 10-second publishing. This is valuable for aggressive auto scaling, highly variable traffic patterns, or deep troubleshooting.
Example use cases
In this post, we walk through three common scenarios where Enhanced Metrics delivers measurable business value, all of which are available in this notebook :
- Real-time GPU utilization tracking across Inference Components
When running multiple models on shared infrastructure using Inference Components, understanding GPU allocation and utilization is critical for cost optimization and performance tuning.With enhanced metrics, you can query GPU allocation per inference component:
response = cloudwatch.get_metric_data(
  MetricDataQueries=[ {
    'Id': 'm1',
    'Expression': 'SEARCH('{/aws/sagemaker/InferenceComponents,InferenceComponentName,GpuId} MetricName="GPUUtilizationNormalized" InferenceComponentName="IC-my-model"', 'SampleCount', 10)'
  }, {
    'Id': 'e1',
    'Expression': 'SUM(m1)' # Returns GPU count
  } ],
  StartTime=start_time,
  EndTime=end_time )
This query uses the GpuId dimension to count individual GPUs allocated to each inference component. By tracking the SampleCount statistic, you get a precise count of GPUs in use for a specific Inference Component, which is essential for:
- Validating resource allocation matches your configuration
- Detecting when inference components scale up or down
- Calculating per-GPU costs for chargeback models
- Per-model cost attribution in multi-model deployments
One of the most requested capabilities is understanding the true cost of each model when multiple models share the same endpoint infrastructure. Enhanced metrics make this possible through container-level GPU tracking.Here’s how to calculate cumulative cost per model:
response = cloudwatch.get_metric_data(
  MetricDataQueries=[ {
    'Id': 'e1',
    'Expression': 'SEARCH('{/aws/sagemaker/InferenceComponents,InferenceComponentName,GpuId} MetricName="GPUUtilizationNormalized" InferenceComponentName="IC-my-model"', 'SampleCount', 10)'
  }, {
    'Id': 'e2',
    'Expression': 'SUM(e1)' # GPU count
  }, {
    'Id': 'e3',
    'Expression': 'e2 * 5.752 / 4 / 360' # Cost per 10s based on ml.g6.12xlarge hourly cost
  }, {
    'Id': 'e4',
    'Expression': 'RUNNING_SUM(e3)' # Cumulative cost
  } ],
  StartTime=start_time, EndTime=end_time )
This calculation:
- Counts GPUs allocated to the inference component (e2)
- Calculates cost per 10-second period based on instance hourly cost (e3)
- Accumulates total cost over time using
RUNNING_SUM(e4)
For example, with an ml.g6.12xlarge instance ($5.752/hour for 4 GPUs), if your model uses 4 GPUs, the cost per 10 seconds is $0.016. The RUNNING_SUM provides a continuously increasing total, perfect for dashboards and cost tracking.
- Cluster-wide resource monitoring
Enhanced metrics enable comprehensive cluster monitoring by aggregating metrics across all inference components on an endpoint:
response = cloudwatch.get_metric_data(
  MetricDataQueries=[ {
    'Id': 'e1',
    'Expression': 'SUM(SEARCH('{/aws/sagemaker/InferenceComponents,EndpointName,GpuId} MetricName="GPUUtilizationNormalized" EndpointName="my-endpoint"', 'SampleCount', 10))'
  }, {
    'Id': 'm2',
    'MetricStat': {
      'Metric': {
        'Namespace': '/aws/sagemaker/Endpoints',
        'MetricName': 'CPUUtilizationNormalized',
        'Dimensions': [ {
          'Name': 'EndpointName',
          'Value': 'my-endpoint'
        }, {
          'Name': 'VariantName',
          'Value': 'AllTraffic'
        }
      ] },
      'Period': 10,
      'Stat': 'SampleCount' # Returns instance count
    }
  }, {
    'Id': 'e2',
    'Expression': 'm2 * 4 - e1' # Free GPUs (assuming 4 GPUs per instance)
  } ],
  StartTime=start_time, EndTime=end_time )
This query provides:
- Total GPUs in use across all inference components (e1)
- Number of instances in the endpoint (m2)
- Available GPUs for new deployments (e2)
This visibility is crucial for capacity planning and making sure that you have sufficient resources for new model deployments or scaling existing ones.
Creating operational dashboards
The accompanying notebook demonstrates how to create CloudWatch dashboards programmatically that combine these metrics:
from endpoint_metrics_helper import create_dashboard
create_dashboard(
dashboard_name='my-endpoint-monitoring',
endpoint_name='my-endpoint',
inference_components=[ {
'name': 'IC-model-a',
'label': 'MODEL_A'
}, {
'name': 'IC-model-b',
'label': 'MODEL_B'
} ],
cost_per_hour=5.752,
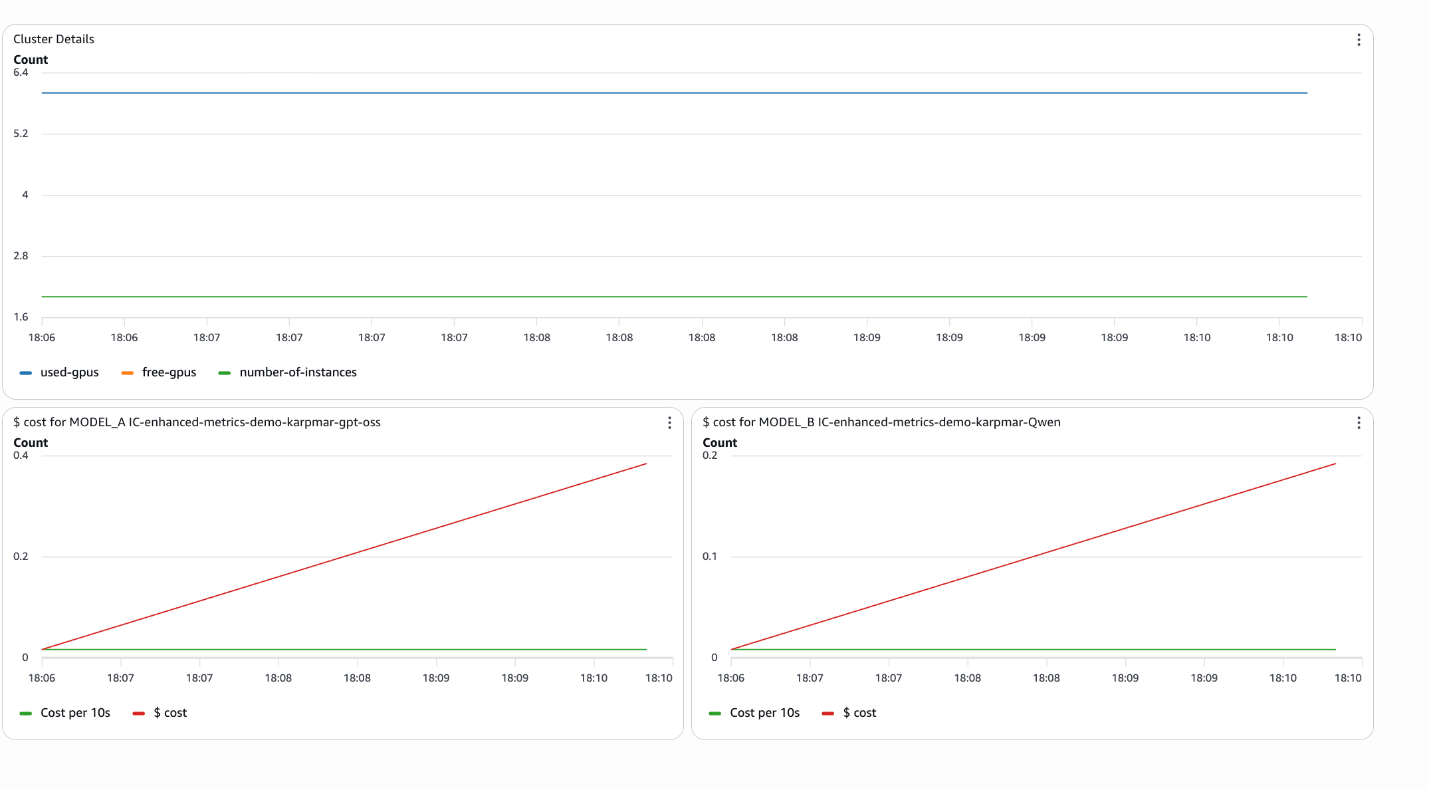
region='us-east-1' )This creates a dashboard with:
- Cluster-level resource utilization (instances, used/unused GPUs)
- Per-model cost tracking with cumulative totals
- Real-time cost per 10-second period
The notebook also includes interactive widgets for ad-hoc analysis.
from endpoint_metrics_helper import create_metrics_widget, create_cost_widget
# Cluster metrics
create_metrics_widget('my-endpoint')
# Per-model cost analysis
create_cost_widget ('IC-model-a', cost_per_hour=5.752)
These widgets provide dropdown time range selection (last 5/10/30 minutes, 1 hour, or custom range) and display:
- Number of instances
- Total/used/free GPUs
- Cumulative cost per model
- Cost per 10-second period
Best practices
- Start with a 60-second resolution: This provides sufficient granularity for most use cases while keeping CloudWatch costs manageable. Note that only Utilization metrics generate CloudWatch charges. All other metric types are published at no additional cost to you.
- Use 10-second resolution selectively: Enable high-resolution metrics only for critical endpoints or during troubleshooting periods.
- Use dimensions strategically: Use
InferenceComponentName,ContainerId, andGpuIddimensions to drill down from cluster-wide views to specific containers. - Create cost allocation dashboards: Use
RUNNING_SUMexpressions to track cumulative costs per model for accurate chargeback and budgeting. - Set up alarms on unused GPU capacity: Monitor the unused GPU metric to make sure that you maintain buffer capacity for scaling or new deployments.
- Combine with invocation metrics: Correlate resource utilization with request patterns to understand the relationship between traffic and resource consumption.
Conclusion
Enhanced Metrics for Amazon SageMaker AI Endpoints transforms how you monitor, improve, and operate production ML workloads. By providing container-level visibility with configurable publishing frequency, you gain the operational intelligence needed to:
- Accurately attribute costs to individual models in multi-tenant deployments
- Monitor real-time GPU allocation and utilization across inference components
- Track cluster-wide resource availability for capacity planning
- Troubleshoot performance issues with precise, granular metrics
The combination of detailed metrics, flexible publishing frequency, and rich dimensions helps you to build sophisticated monitoring solutions that scale with your ML operations. Whether you’re running a single model or managing dozens of inference components across multiple endpoints, enhanced metrics provide the visibility you need to run AI efficiently at scale.
Get started today by enabling enhanced metrics on your SageMaker AI endpoints and explore the accompanying notebook for complete implementation examples and reusable helper functions.
About the authors