The successful deorbit, descent, and landing of spacecraft on the Moon requires precise control and monitoring of vehicle dynamics. Anomaly detection provides a unique utility for identifying important states that might represent vehicle behaviors of interest. By producing unique vehicle behavior points, critical spacecraft system states can be identified to be more appropriately addressed and potentially better understood. These identified states can be invaluable for efforts such as system failure mitigation, engineering design improvements, and mission planning. Today, space missions have become more frequent and complex, and the volume of telemetry data generated has grown exponentially. With this growth, methods of analyzing this data for anomalies need to effectively scale and without risking missing subtle, but important deviations in spacecraft behavior. Fortunately, AWS uses powerful AI/ML applications within Amazon SageMaker AI that can address these needs.
In this post, we demonstrate how to use SageMaker AI to apply the Random Cut Forest (RCF) algorithm to detect anomalies in spacecraft position, velocity, and quaternion orientation data from NASA and Blue Origin’s demonstration of lunar Deorbit, Descent, and Landing Sensors (BODDL-TP). The presented analysis focuses on detecting anomalies in spacecraft dynamics data, including positions, velocities, and quaternion orientations.
Solution overview
This solution provides an effective approach to anomaly detection in spacecraft data. We begin with data preprocessing and cleaning to produce quality input for our analysis. Using SageMaker AI, we train an RCF model specifically for detecting anomalies in complex spacecraft dynamics data. To handle the substantial volume of telemetry data efficiently, we implement batch processing for anomaly detection across large datasets.
After the model is trained and anomalies are detected, this solution produces robust visualization capabilities, presenting results with highlighted anomalies for clear interpretation of the findings. We use Amazon Simple Storage Service (Amazon S3) for seamless data storage and retrieval, including both raw data and generated plots. Throughout the implementation, we maintain careful cost management of SageMaker AI instances by deleting resources after they’re used to achieve efficient utilization while maintaining performance.
This combination of features creates a scalable, efficient pipeline for processing and analyzing spacecraft dynamics data, making it particularly suitable for space mission applications where reliability and precision are crucial.
Key concepts
In this section, we discuss some key concepts of spacecraft dynamics and machine learning (ML) in this solution.
Position and velocity in spacecraft dynamics
Position and velocity vectors in our NASA Blue Origin DDL data are represented in the Earth-Centered Earth-Fixed (ECEF) coordinate system. This reference frame rotates with the Earth, making it ideal for tracking spacecraft relative to landing sites on the lunar surface. The position vector [x, y, z] in ECEF pinpoints the spacecraft’s location in three-dimensional space. Its origin is at Earth’s center, with the X-axis intersecting the prime meridian at the equator, the Y-axis 90 degrees east in the equatorial plane, and the Z-axis aligned with Earth’s rotational axis. Measured in meters, this position data can reveal crucial information about orbital descent trajectories, landing approach paths, terminal descent profiles, and final touchdown positioning. Complementing position data, the velocity vector [vx, vy, vz] represents the spacecraft’s rate of position change in each direction. Measured in meters per second, this velocity data is vital for monitoring descent rates, maintaining safe approach speeds, controlling deceleration profiles, and verifying landing constraints. Our RCF algorithm scrutinizes both position and velocity data for anomalies. In position data, it looks for anomalies that might be caused by unexpected trajectory deviations, unrealistic position jumps, sensor glitches, or data recording errors. For velocity, its detected anomalies might be due to sudden speed changes, unusual acceleration patterns, potential thruster misfires, or navigation system issues. The fusion of position and velocity data offers a comprehensive view of the spacecraft’s translational motion. When combined with quaternion data describing rotational state, we obtain a complete picture of the spacecraft’s dynamic state during critical mission phases. These metrics play essential roles in mission planning, real-time monitoring, post-flight analysis, safety verification, C2 (command and control), and overall system performance evaluation. By using these rich datasets and advanced anomaly detection techniques, we enhance our ability to achieve mission success and spacecraft safety throughout the dynamic phases of lunar deorbit, descent, and landing.
Quaternions in spacecraft dynamics
Quaternions play a crucial role in spacecraft attitude (orientation) representation. Although Euler angles (roll, pitch, and yaw) are more intuitive, they can suffer from gimbal lock—a loss of one degree of freedom in certain orientations. Quaternions solve this problem by using a four-parameter representation that avoids such singularities. This representation consists of one scalar component (q0) and three vector components (q1, q2, q3), providing a robust mathematical framework for describing spacecraft orientation. In our NASA Blue Origin DDL data, quaternions serve a vital purpose: they represent the rotation from the spacecraft’s body-fixed coordinate system (CON) to the ECEF frame. This transformation is fundamental to several critical aspects of spacecraft operation, including maintaining precise attitude control during descent, preserving correct thrust vector orientation, facilitating accurate sensor measurements, and computing landing trajectories. For reliable anomaly detection, quaternion values must satisfy two essential mathematical properties. First, they must maintain unit magnitude, meaning the sum of their squared components (q0² + q1² + q2² + q3² = 1) equals one. Second, they must demonstrate continuity, avoiding sudden jumps that would indicate physically impossible rotations. These properties help confirm the validity of our orientation measurements and the effectiveness of our anomaly detection system. When our RCF algorithm identifies anomalies in quaternion data, these could signal various issues requiring attention. Such anomalies might indicate sensor malfunctions, attitude control system issues, data transmission errors, or actual problems with spacecraft orientation. By carefully monitoring these quaternion components alongside position and velocity data, we develop a comprehensive understanding of the spacecraft’s dynamic state during the critical phases of deorbit, descent, and landing.
The Random Cut Forest algorithm
Random Cut Forest is an unsupervised algorithm for detecting anomalies in high-dimensional data. The algorithm’s construction begins by creating multiple decision trees, each built through a process of repeatedly cutting the data space with random hyperplanes. This partitioning continues until each data point is isolated, creating a forest of trees that captures the underlying structure of the data. The novelty of RCF lies in the scoring mechanism. Points located in sparse regions of the data space that require fewer cuts to isolate score higher, while points in dense regions that need more cuts score lower. This fundamental principle allows the algorithm to assign anomaly scores inversely proportional to the number of cuts needed to isolate each point. Higher scores, therefore, indicate potential anomalies, making it straightforward to identify unusual patterns in the data.
In our spacecraft dynamics context, we apply RCF to 10-dimensional vectors that combine position (three dimensions), velocity (three dimensions), and quaternion orientation (four dimensions). Each vector represents a specific moment in time during the spacecraft’s mission states. The flight patterns create dense regions in this high-dimensional space, while anomalies appear as isolated points in sparse regions. This data is high-dimensional, multivariate time series, and has no labels, which RCF handles fairly well while maintaining computational efficiency and handling sensor noise. For this use case, RCF is able to detect subtle deviations between data points of spacecraft dynamics while handling the complex relationships between position, velocity, and orientation parameters. These features of RCF make it an effective tool for spacecraft dynamics monitoring analysis and anomaly detection.
Solution architecture
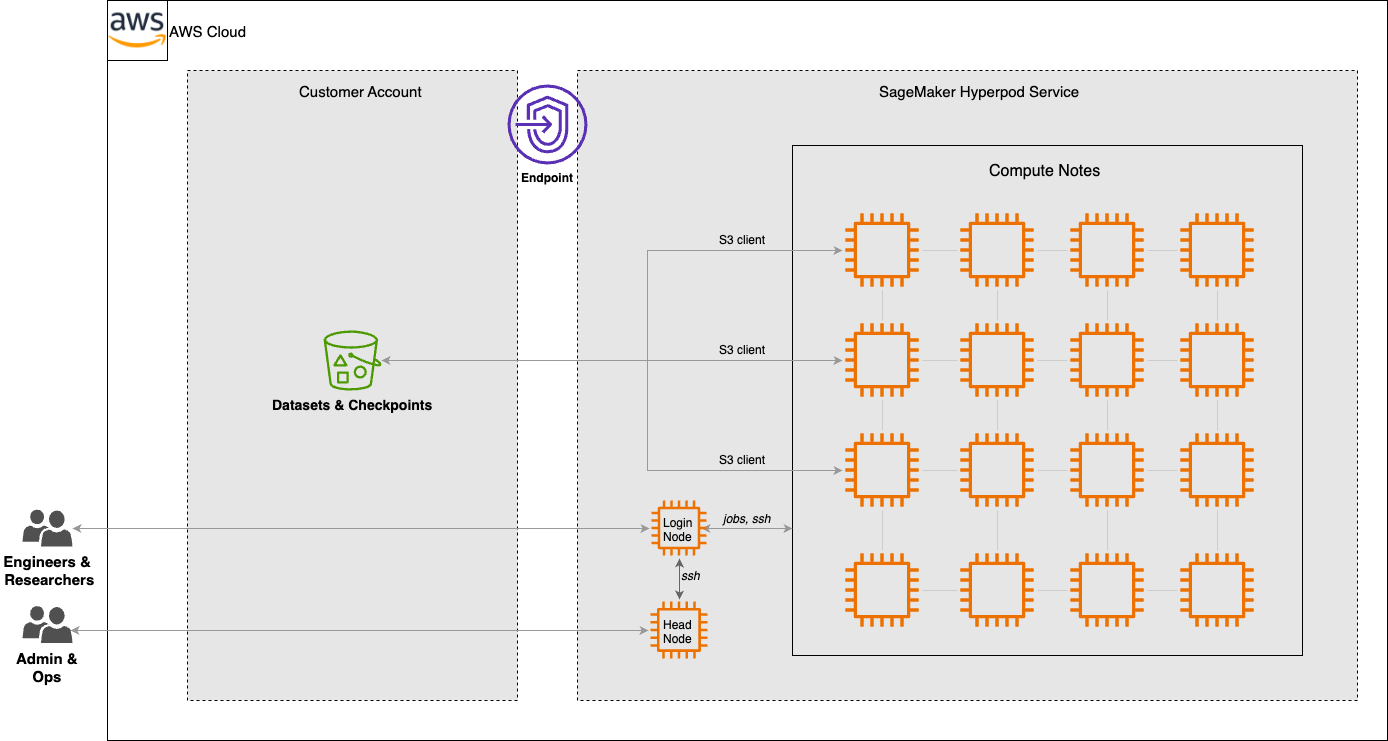
The solution architecture implements anomaly detection for NASA-Blue Origin Lunar DDL data using the RCF algorithm, as illustrated in the following diagram.

Our solution’s data flow begins with public DDL (Deorbit, Descent, and Landing) data securely stored in an S3 bucket. This data is then accessed through a SageMaker AI domain using JupyterLab, providing a powerful and flexible environment for data scientists and engineers. Within JupyterLab, we use a custom notebook to process the raw data and implement our anomaly detection algorithms.
The core of our solution lies in the processing pipeline. It starts in the JupyterLab notebook, where we train an RCF model using SageMaker AI. After it’s trained, this model is deployed to a SageMaker AI endpoint, creating a scalable and responsive anomaly detection service. We then feed our spacecraft dynamics data through this model to identify potential anomalies. The pipeline concludes by generating detailed visualizations of these anomalies, providing clear and actionable insights.
For output, our system saves both the detected anomaly data and the generated plots back to Amazon S3. This makes sure the results are securely stored and accessible for further analysis or reporting. Additionally, we preserve all training data and model outputs in Amazon S3, enabling reproducibility and facilitating iterative improvements to our anomaly detection process. Throughout these operations, we maintain robust security measures, using Amazon Virtual Private Cloud (Amazon VPC) to enforce data privacy and integrity at every step of the process.
Prerequisites
Before standing up the project, you must set up the necessary tools and access rights:
- The AWS environment should include an active AWS account with appropriate permissions for running ML workloads, along with the AWS Command Line Interface (AWS CLI) for command line operations installed
- Access to SageMaker AI is essential for the ML implementation
- On the development side, Python 3.7 or later needs to be installed, along with several key Python packages:
- Boto3 for AWS service integration
- Pandas for data manipulation
- Matplotlib for visualization
- NumPy for numerical operations
- The SageMaker AI Python SDK for interacting with the SageMaker services
Set up the solution
The setup process includes accessing the SageMaker AI environment, where all the data analysis and model training is executed.
- On the SageMaker AI console, open the SageMaker domain details page.
- Open JupyterLab, then create a new Python notebook instance for this project.
- When the environment is ready, open a terminal in SageMaker AI JupyterLab to clone the project repository using the following commands:
- Install the required Python libraries:
pip install -r requirements.txt
This process will set up the necessary dependencies for running anomaly detection analysis on the spacecraft data.
Execute anomaly detection
Update the bucket_name and file_name variables in the script with your S3 bucket and data file names.
Run the script in JupyterLab as a Jupyter notebook or run as a Python script: python Lunar_DDL_AD.py
Upon execution, the notebook or script performs a series of automated tasks to analyze the spacecraft data. It begins by loading and preprocessing the raw data, making sure it’s in the correct format for analysis. Next, it trains and deploys an RCF model using SageMaker AI, establishing the foundation for our anomaly detection system. When the model is operational, it processes the spacecraft dynamics data to identify potential anomalies in position, velocity, and quaternion measurements. Finally, the script generates detailed visualizations of these findings and automatically uploads both the plots and analysis results to Amazon S3 for secure storage and straightforward access.
Code structure
The Python implementation centers around an anomaly detection pipeline, structured in the main script. At its core is the AnomalyDetector class, which orchestrates the entire workflow from data ingestion to visualization. This class contains several methods that together process spacecraft telemetry data and identify anomalies.
The load_and_prepare_data method handles the initial data ingestion and preprocessing, making sure spacecraft measurements are properly formatted for analysis. After the data is prepared, train_and_deploy_model trains the RCF model and deploys it as a SageMaker endpoint. The predict_anomalies method then uses this trained model to identify unusual patterns in the spacecraft’s position, velocity, and quaternion data.
For visualization and storage, the plot_results method creates detailed graphs highlighting detected anomalies, and upload_plot_to_s3 makes sure these visualizations are securely stored in Amazon S3 for future reference and centralized access.
Together, these components create a comprehensive pipeline for processing spacecraft telemetry data and identifying potential anomalies that might warrant further investigation.
Configuration
Adjust the following parameters in the script as needed:
threshold_percentilefor the threshold for anomaly classification- RCF hyperparameters in
train_and_deploy_model:feature_dim: Number of input featuresnum_samples_per_tree: Random data points per treenum_trees: Number of trees in the algorithmic forest
batch_sizeinpredict_anomaliesfor large datasets
For RCF applications, the hyperparameters and threshold configuration significantly influence anomaly detections. We use the following configuration values for this example:
threshold_percentile=0.9- RCF hyperparameters in
train_and_deploy_model():feature_dim=10num_samples_per_tree=512num_trees=100
batch_size=1000inpredict_anomalies()
SageMaker AI instance type size for training and inference can affect anomaly results, processing time, and cost. In this example, we used an ml.m5.4xlarge instance for both training and inference.
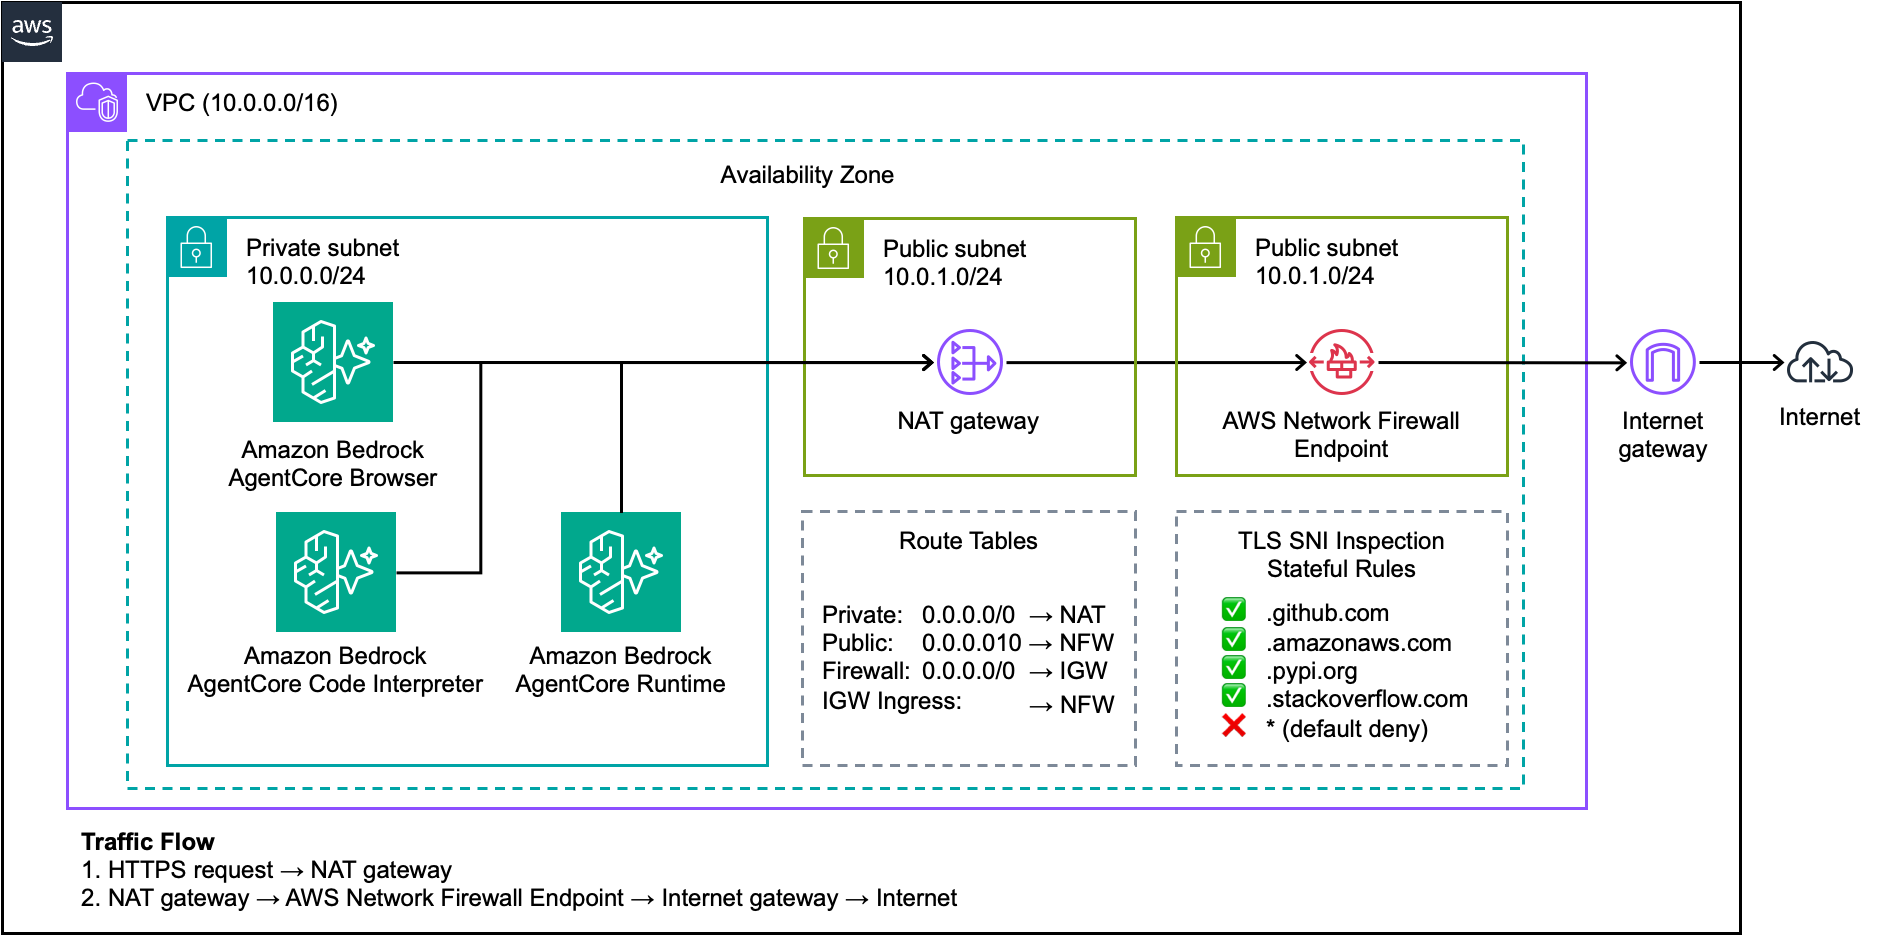
In addition, SageMaker AI can be integrated with various security features for protecting sensitive data and models. It’s possible to operate in no internet or VPC only modes so SageMaker AI instances remain isolated within your Amazon VPC. Secure data access can also be achieved through AWS PrivateLink, enabling private connections to Amazon S3 without internet exposure. Also, integration with AWS Identity and Access Management (IAM) provides fine-grained access control through custom user profiles, enforcing data privacy and adhering to the principle of least privilege, such as when using sensitive spacecraft telemetry data. These are some of the security enhancement services that can be applied according to your appropriate use case with SageMaker AI.
Data
The script uses public NASA-Blue Origin Demo of Lunar Deorbit, Descent, and Landing Sensors (BODDL-TP) data, which you can download. Make sure your data is in the correct format with columns for timestamps, positions, velocities, and quaternions.
Results
The script generates plots for positions, velocities, and quaternions. The respective data is plotted and the anomalies are plotted as an overlay in red. The plots are saved to the specified S3 bucket. Due to the small scale, the positions plot is difficult to observe anomalies. However, the SageMaker AI RCF algorithm can detect them and are highlighted in red. In the following plots, the sharp changes in velocities and quaternions correspond with the anomalies shown.

Unlike the positions plot, the velocities plot shows discontinuities, which are detected as anomalies. This is likely due to rate changes for vehicle maneuvers during the deorbit, descent, and landing demonstration stages.

Similarly to the velocities plot, the quaternions plot shows sharp changes, which are also detected as anomalies. This is likely due to rotational accelerations during vehicle maneuvers of the deorbit, descent, and landing demonstration stages.

These anomalies most likely represent the lunar spacecraft vehicle dynamics at key maneuver stages of the deorbit, descent, and landing demonstration. Momentum wheels, thrusters, and various other C2 applications could be the cause of the observed abrupt positional, velocity, and quaternion changes being detected as anomalous. By having these results, data points of interest are indicated for more precise and potentially valuable analysis for improved vehicle health and status awareness.
Clean up
The provided script includes SageMaker AI endpoint deletion after training and inference to avoid any unnecessary charges. If you’re using JupyterLab and want to further avoid charges, stop the SageMaker AI instance running the RCF JupyterLab Python notebook.
Conclusion
In this post, we demonstrated how the SageMaker AI RCF algorithm can effectively detect anomalies in spacecraft dynamics data from NASA and Blue Origin’s lunar Deorbit, Descent, and Landing demonstration. By detecting anomalies for position, velocity, and quaternion orientation data, we’ve shown how ML can enhance space mission analysis, situational awareness, and autonomy. The built-in algorithm processes complex, multi-dimensional spacecraft telemetry data. Through efficient batch processing, we can analyze large-scale mission data effectively, and our visualization approach enables quick identification of potential issues in spacecraft dynamics. From there, the solution’s scalability shows the ability adapt to handle varying data volumes and mission durations, making it potentially suitable for a wide range of space applications. Although this solution applies to a lunar mission demonstration, the approach could have broad applications throughout the space industry. You can adapt the same architecture for various space operations, such as landing missions on other celestial bodies, orbital rendezvous, space station docking, and satellite constellations. This integration of AWS services with aerospace applications creates a robust, secure, and scalable platform for space mission analytics, which is becoming increasingly valuable as we continue to execute missions in the space environment. Looking forward, this solution opens many possibilities for enhancement and expansion. Real-time anomaly detection could be implemented for live mission data, providing immediate insights during critical operations. Also, the system could be enhanced by incorporating additional spacecraft parameters and sensor data, and automated alert services could be developed to provide immediate notification of detected anomalies. In addition, further developments might include extending the analysis to incorporate predictive ML models and creating custom metrics tailored to specific mission requirements. These potential advancements would continue to build upon the foundation we’ve established, creating even more powerful tools for spacecraft mission analysis.
The code and implementation details are available in our GitHub repository, enabling you to adapt and enhance the solution for your specific needs.
For space operations, the combination of cloud computing and ML have strong potential to play an increasingly crucial role in ensuring mission success. This solution demonstrates just one of many possible applications of AWS services for improving spacecraft mission compute and data analysis.
To learn more about the AWS services used in this solution, refer to Guide to getting set up with Amazon SageMaker AI, Train a Model with Amazon SageMaker, and the JupyterLab user guide.
About the authors
 Dr. Ian Lunsford is an Aerospace AI Engineer at AWS Professional Services. He integrates cloud services into aerospace applications. Additionally, Ian focuses on building AI/ML solutions using AWS services.
 Nick Biso is a Machine Learning Engineer at AWS Professional Services. He solves complex organizational and technical challenges using data science and engineering. In addition, he builds and deploys AI/ML models on the AWS Cloud. His passion extends to his proclivity for travel and diverse cultural experiences.